In our previous blog post, we explored 11 factors for choosing your data annotation platform when building AI/ML pipelines. One key factor is Project & Dataset Management: a crucial aspect for teams that deal with image labeling, image annotation, and data labeling on a regular basis.
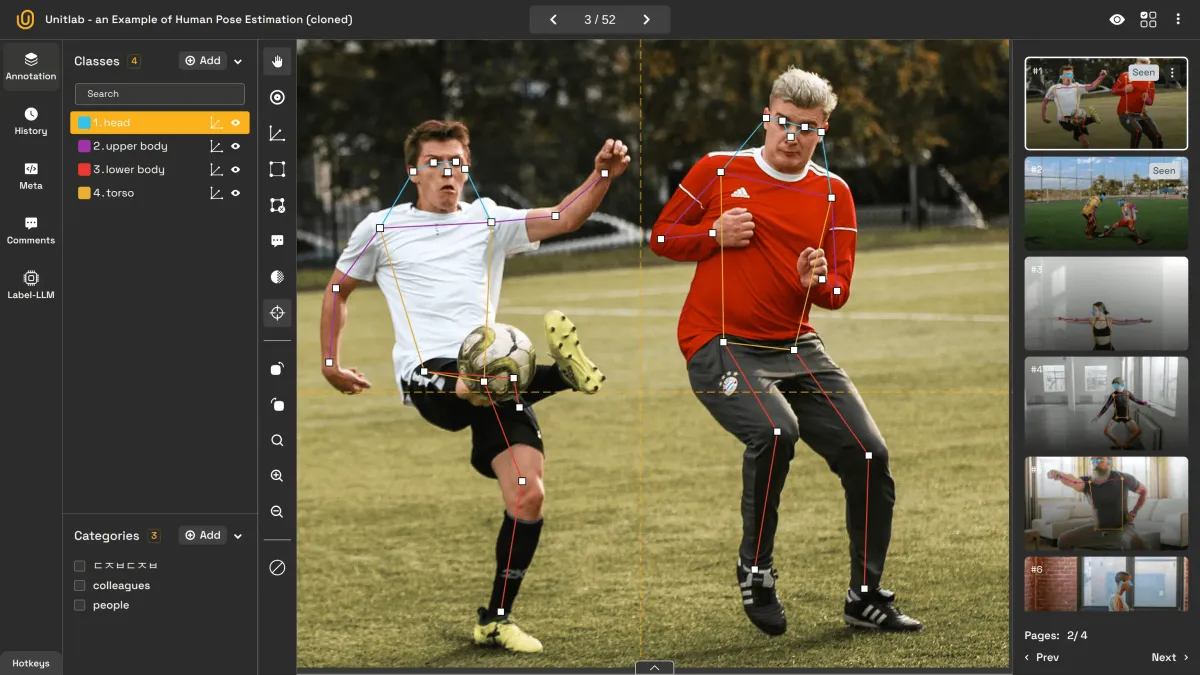
11 Factors in Choosing Image Annotation Tools | Unitlab Annotate
Project management refers to the systems that help you oversee image labeling tasks, while dataset management ensures that labeled datasets are prepared for the next stage of AI/ML development.
A critical part of that process is having project and member statistics, which let managers track progress and keep the pipeline on schedule through real-time analytics and dashboards. Such analytics are integral to any image annotation solution, image labeling solution, or data annotation solution aiming to streamline AI dataset management.
Analytics matter in team projects because control matters in team projects. It’s one thing to plan image labeling or image data annotation tasks; it’s another to ensure those plans are truly followed. Without control, planning doesn’t cut it.
Performance analytics (statistics on both projects and team members) provide a reliable way to compare actual results to planned targets, offering insights across data annotation contexts, including image labeling, data auto-annotation, and auto labeling.
Many organizations realize that image labeling pipelines need more than a neat workflow; they demand robust performance analytics and a suitable image labeling tool or data labeling tool. In this post, we’ll explore the broad power of analytics and then focus on how it applies to image labeling and ML datasets.
Introduction
Anyone who’s run a project knows that success depends on organizing tasks, watching progress, and tackling bottlenecks before they explode. Even the best budgeted plans can clash with real-world surprises, external issues, or random disruptions. With so many factors at play, it can be tough to nail down what’s slowing things down. Are we behind because morale is low? Because the tasks aren’t allocated properly? Because of a hidden bottleneck? Or a mix of all these?
Performance analytics isn’t some magic wand that solves every problem. Numbers alone won’t tell you if morale is low, if resources are misplaced, or if your annotation platform is clunky. But they do offer quantitative insights about how your project is really performing.
For example:
- Which milestones are being hit on time?
- How many images have been annotated, reviewed, and approved?
- What’s the ratio of labeled images to approved images, and what does that say about quality?
- How long does each image take to label, on average?
By answering these questions, you can spot inefficiencies in your image annotation solution or data annotation solution and take action. If your chosen image labeling tool doesn’t provide adequate analytics, paradoxically, that gap can itself become a bottleneck in your pipeline.
In this post, we’ll explore why project and member statistics matter, how to turn raw numbers into concrete actions, and how you can apply these insights using Unitlab Annotate, a collaborative, AI-powered data annotation platform.
What Are Project and Member Statistics?
Performance analytics generally break down into project statistics and member statistics. Both are equally important and complement each other in giving a complete view of progress and productivity.
Project Statistics
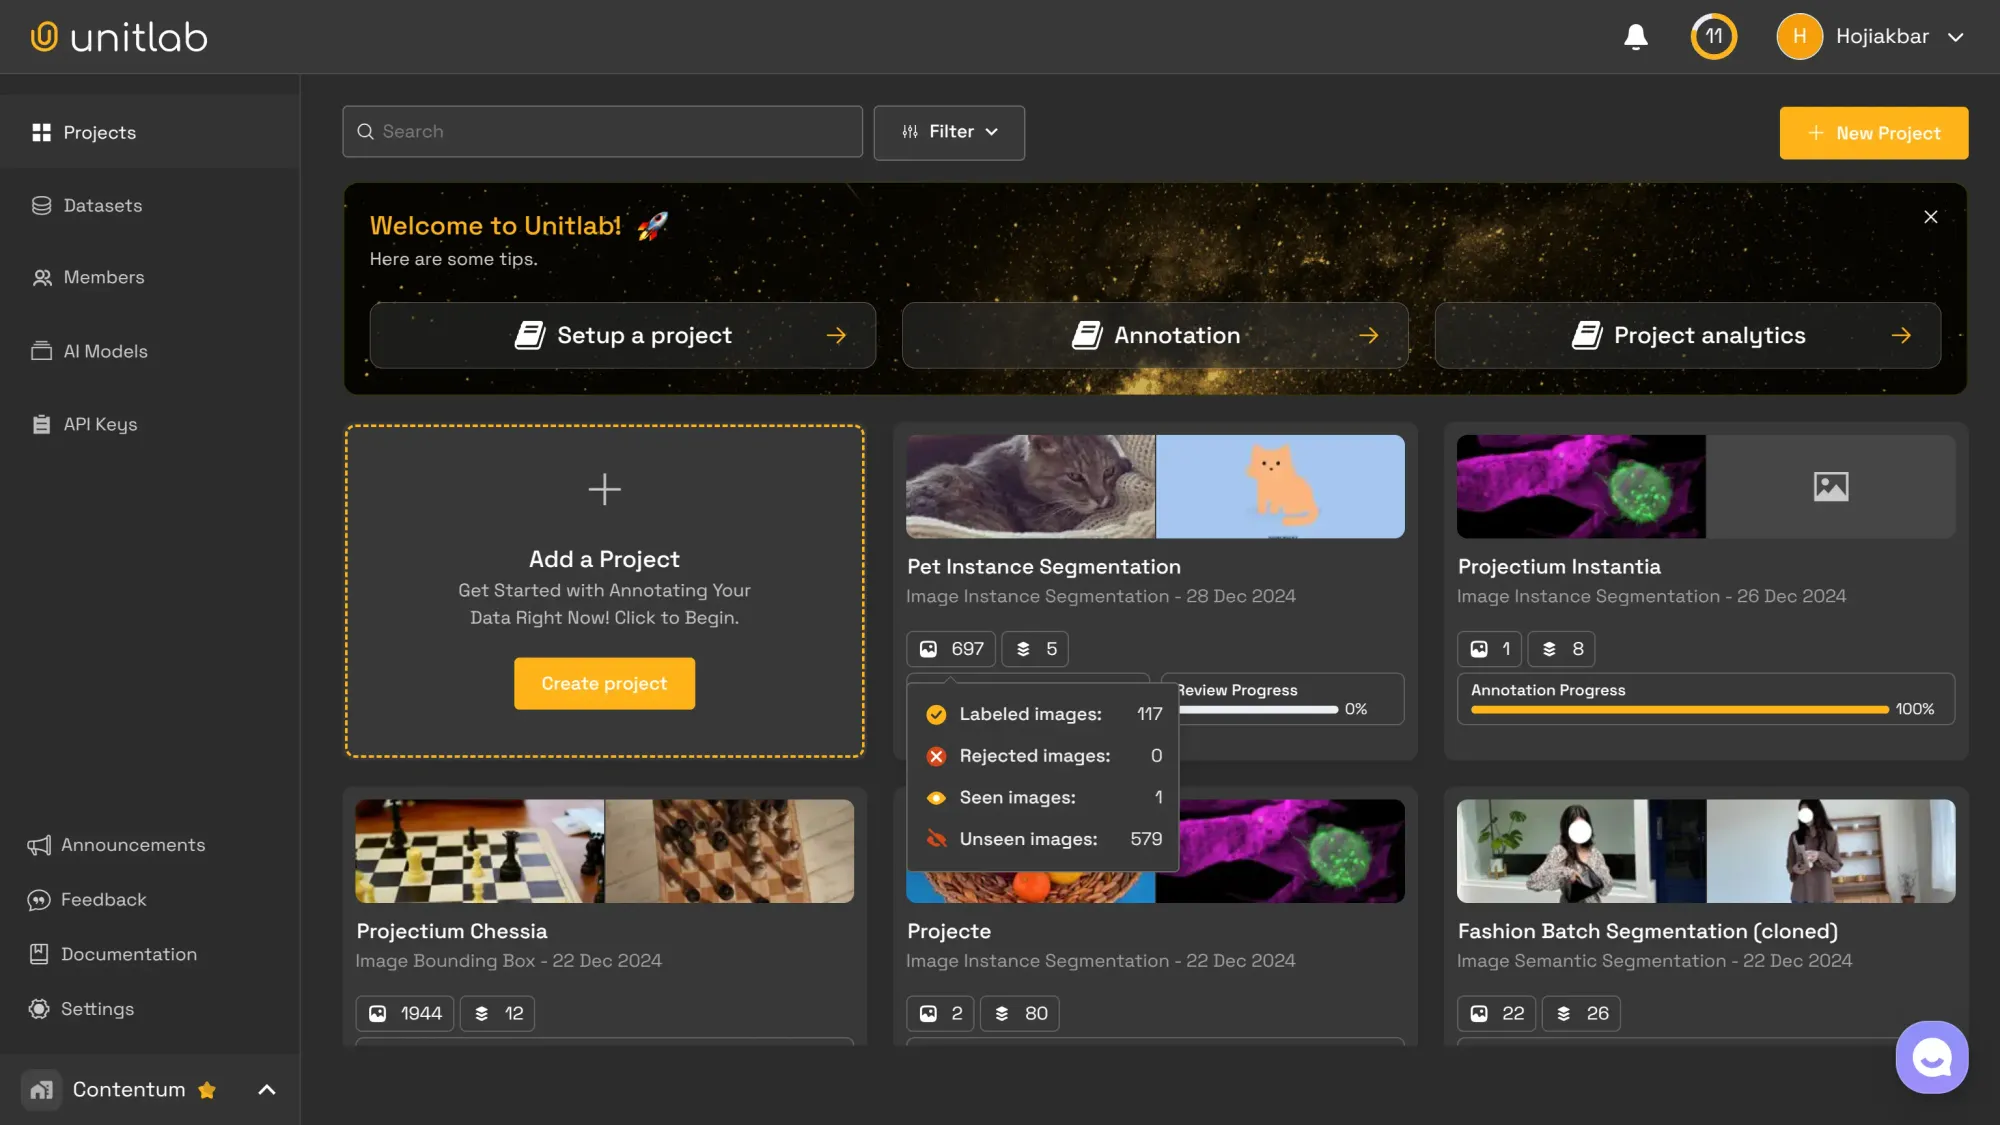
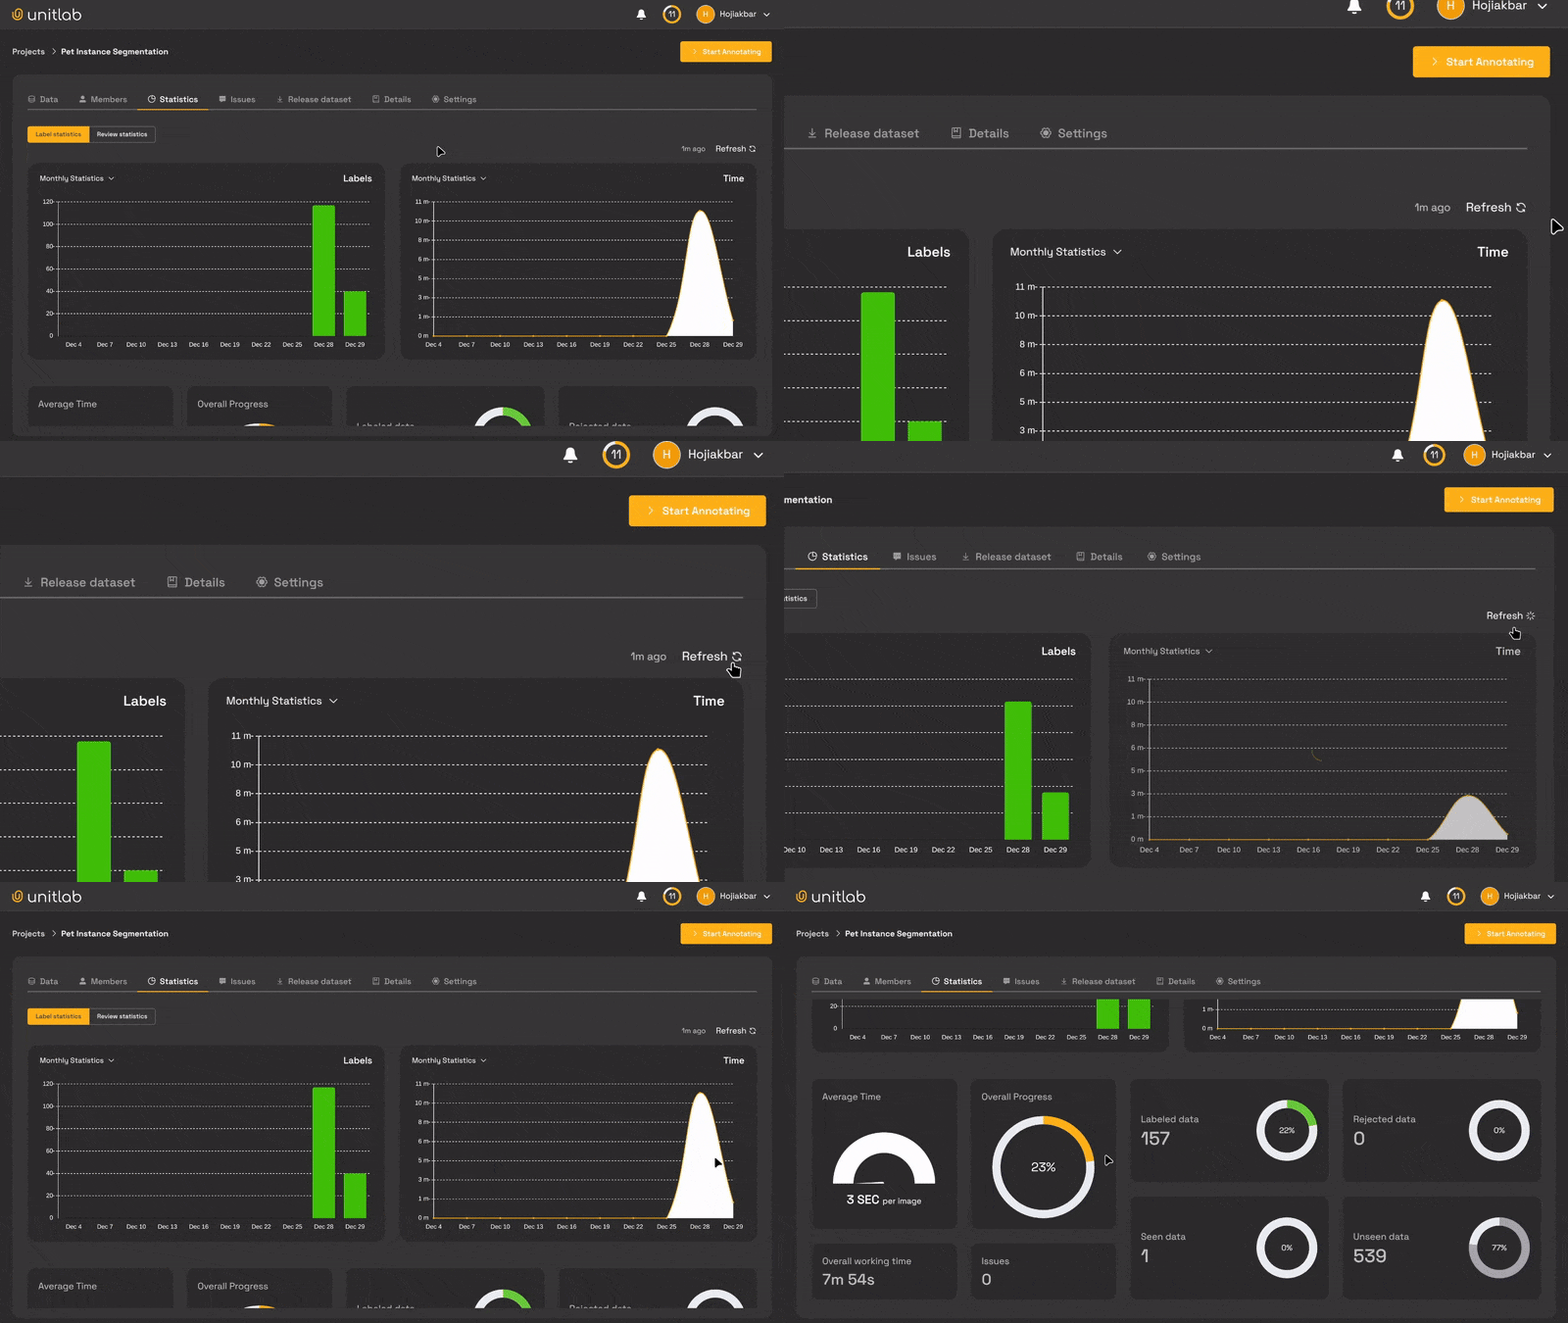
These deliver real-time performance metrics for your entire project, including:
- Labeled, reviewed, approved, and rejected image counts
- Total working time and time spent per image
- Monthly annotation statistics
- Annotation and review progress
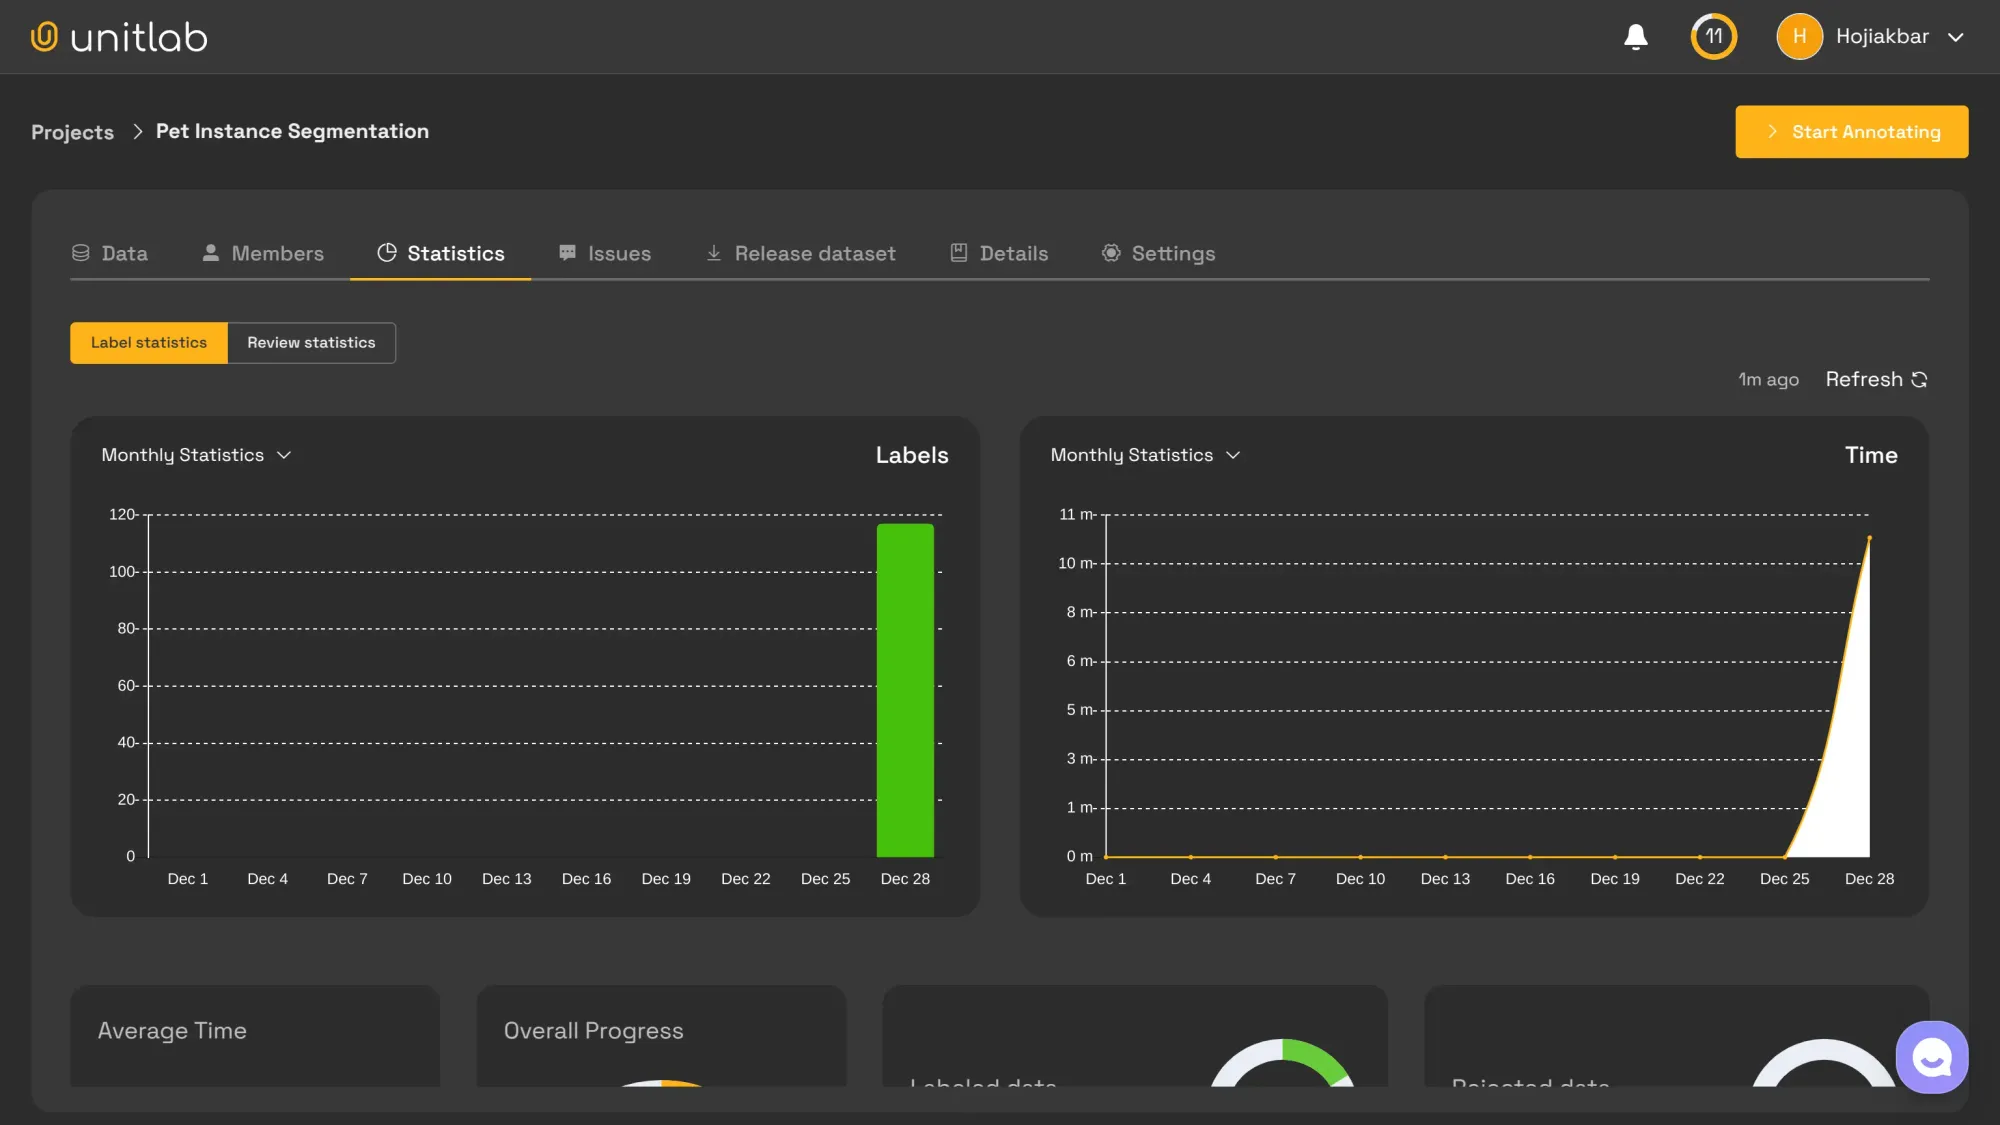
These metrics address high-level questions:
- Are we meeting our weekly goals?
- How many images have been annotated and reviewed so far?
- What is the overall quality of the labeled images?
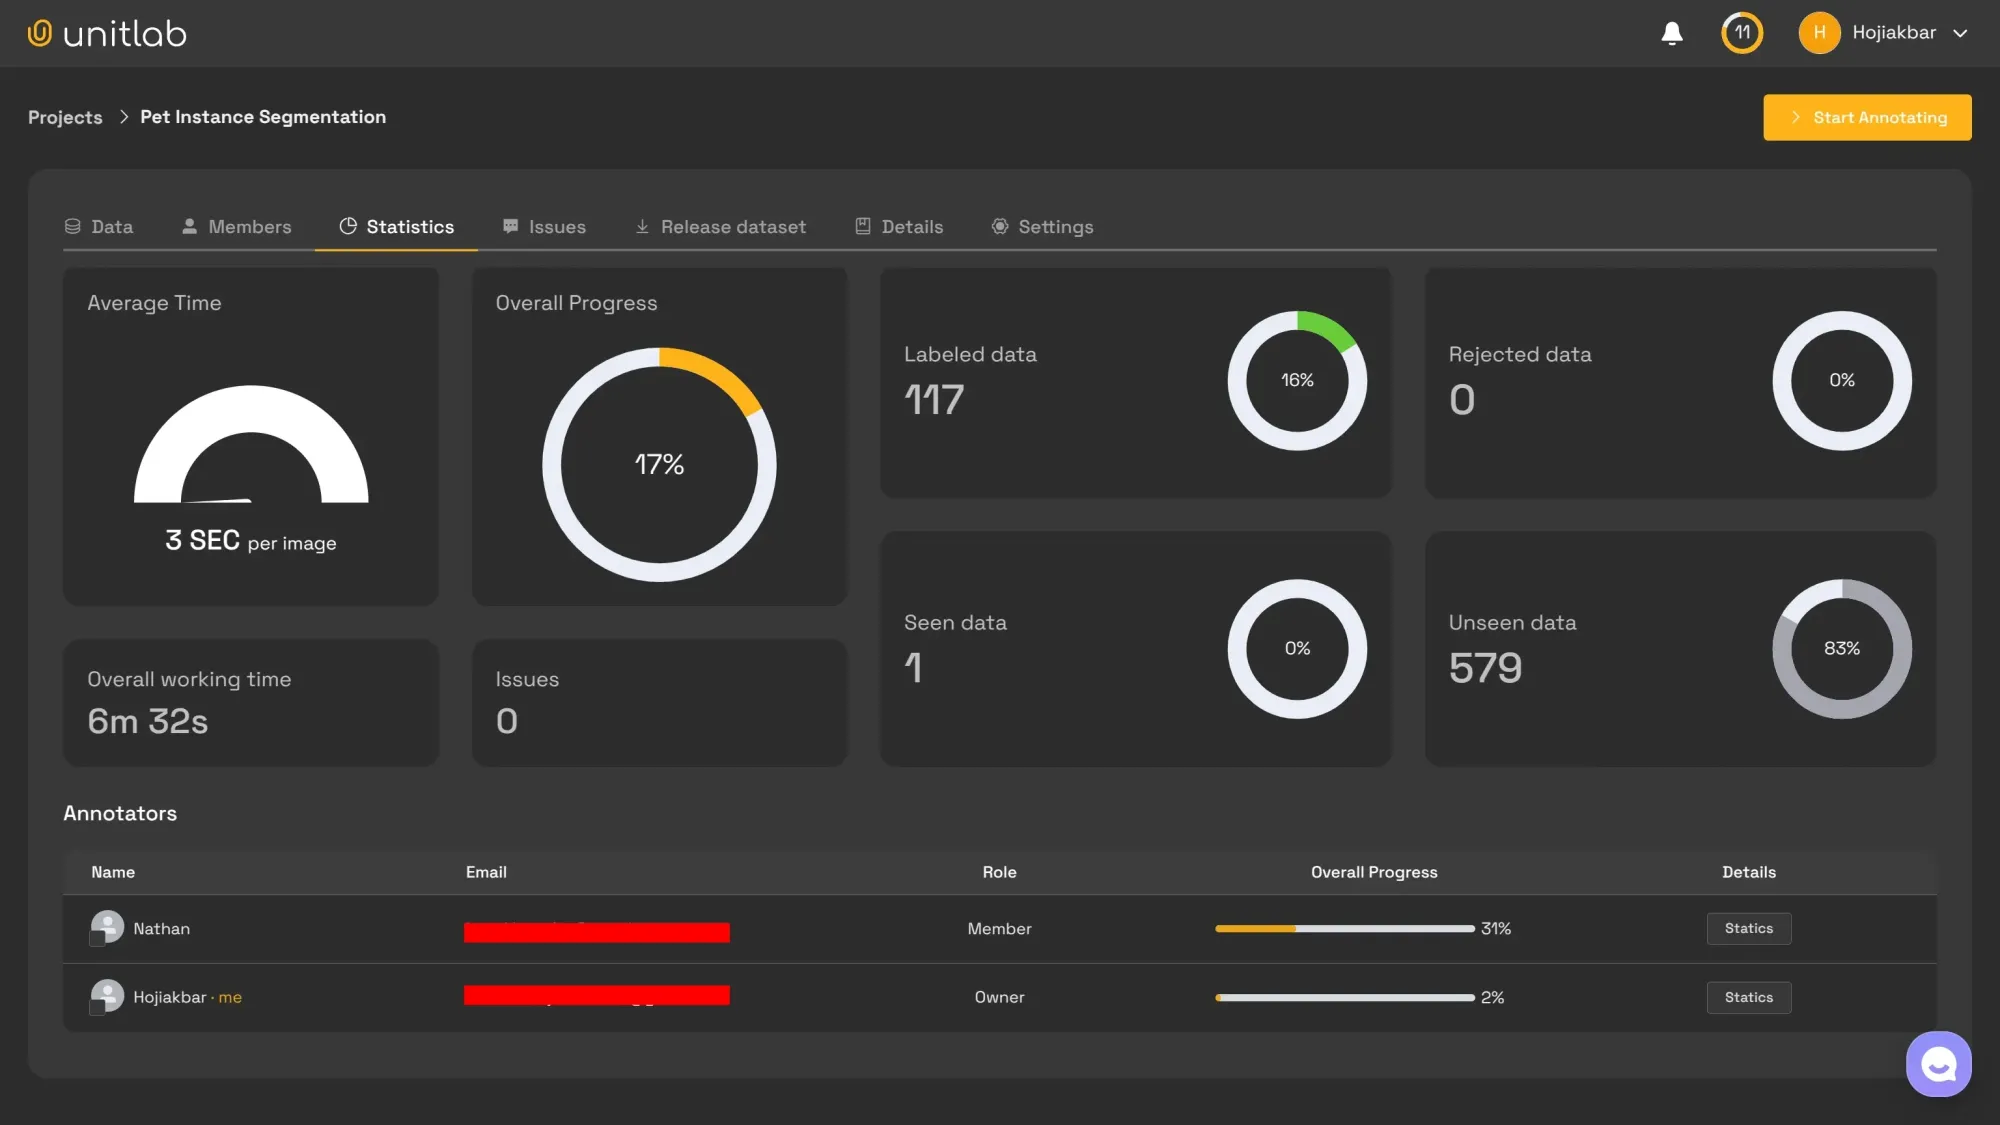
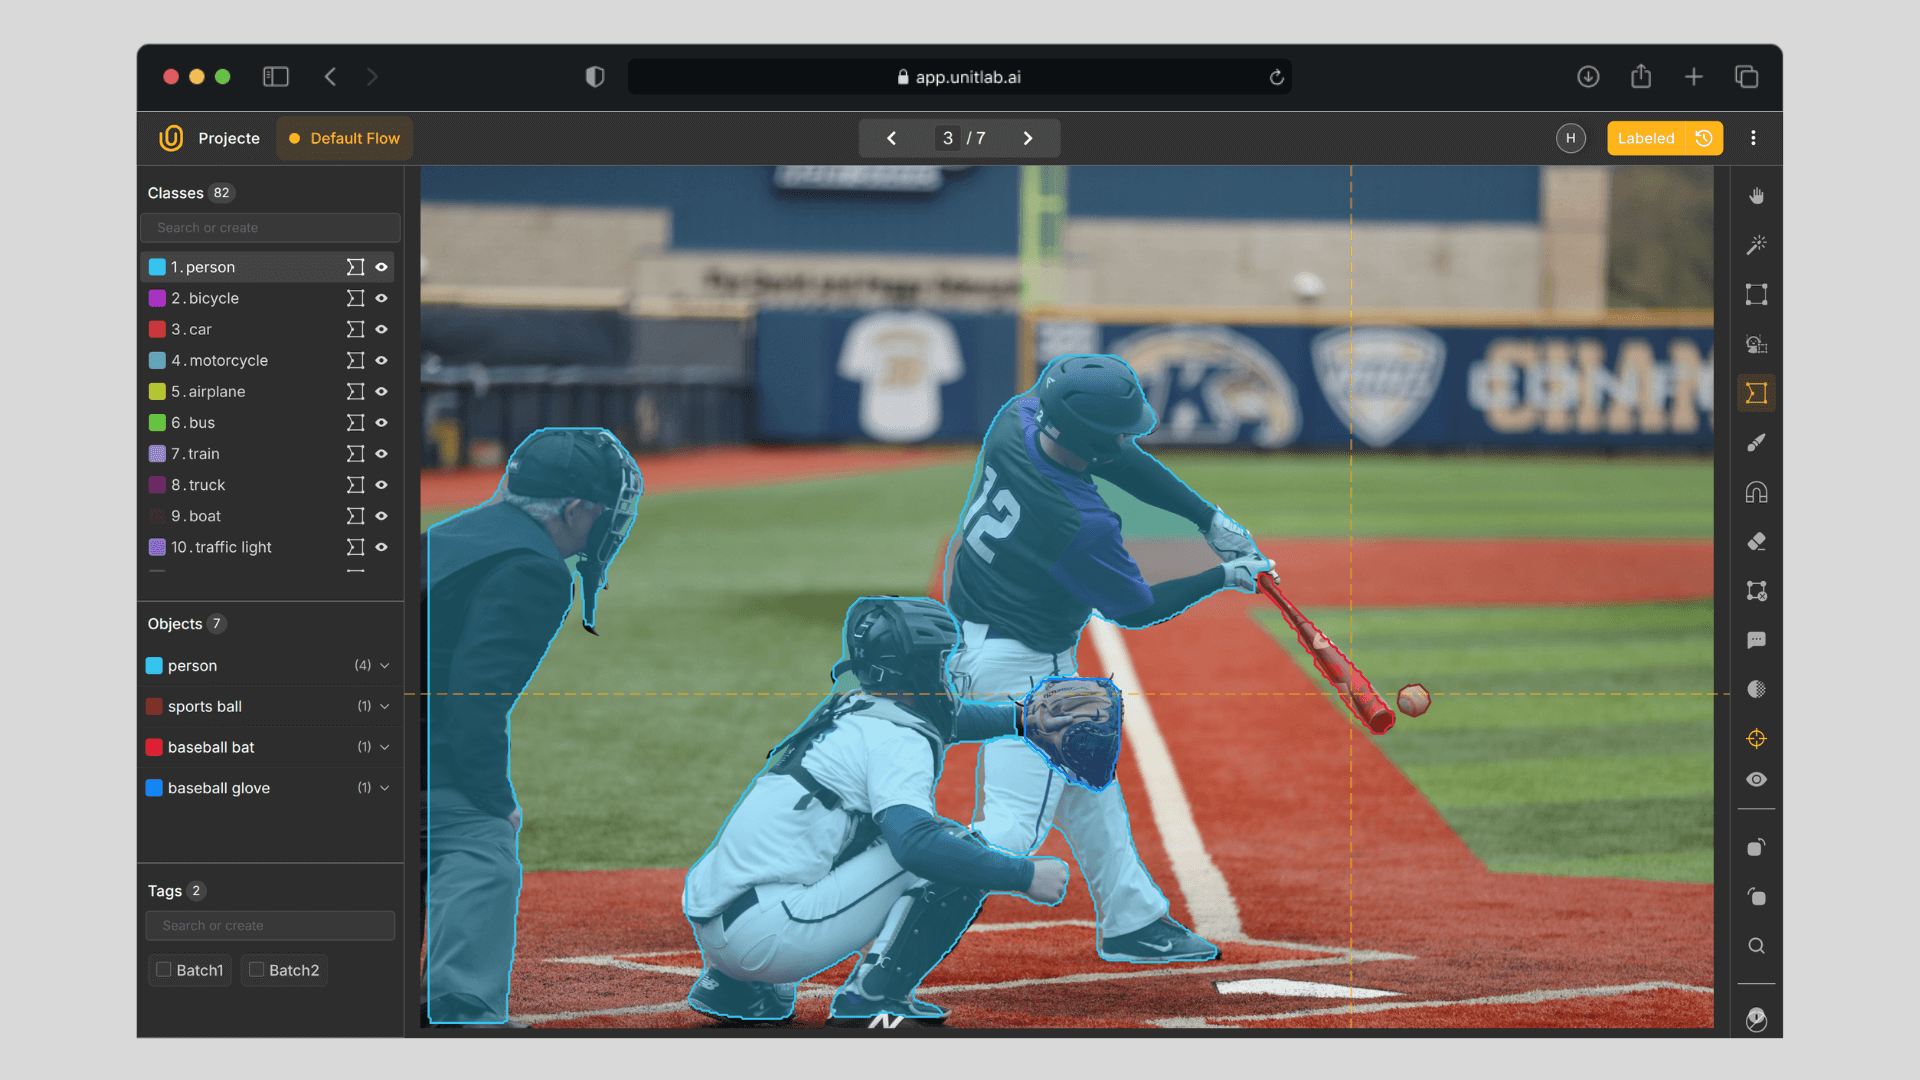
If you're wondering how it is possible to label 117 images in under just 7 minutes, we can use various AI-powered auto-annotation tools depending on the project. AI data labeling tools are strikingly accurate; a human image labeler then can fix any inconsistencies (if any); then a reviewer can do a final check.
This three-step human-in-the-loop approach ensures that image annotations are both fast and of high quality.
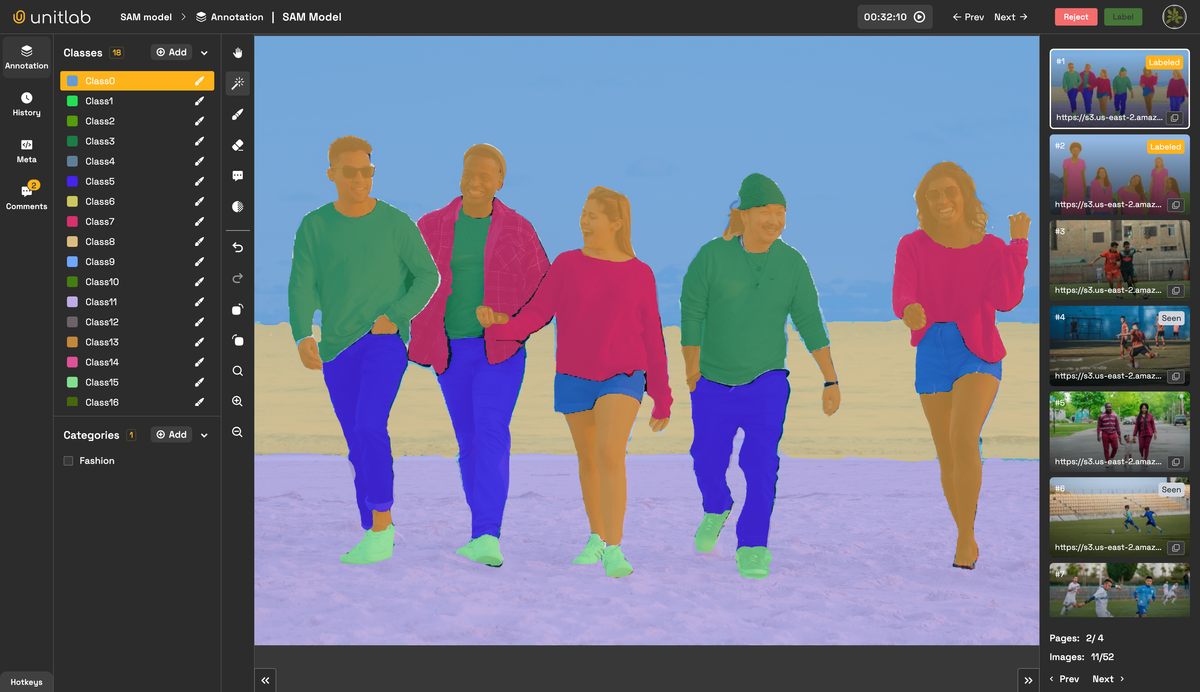
Automated data annotation | Unitlab Annotate
Member Statistics
The second category, often lacking in many data labeling platforms, highlights individual contributions. For example:
- Each person’s performance (tasks completed, average quality).
- Consistency over time.
- Time spent per member and the quality of their results.
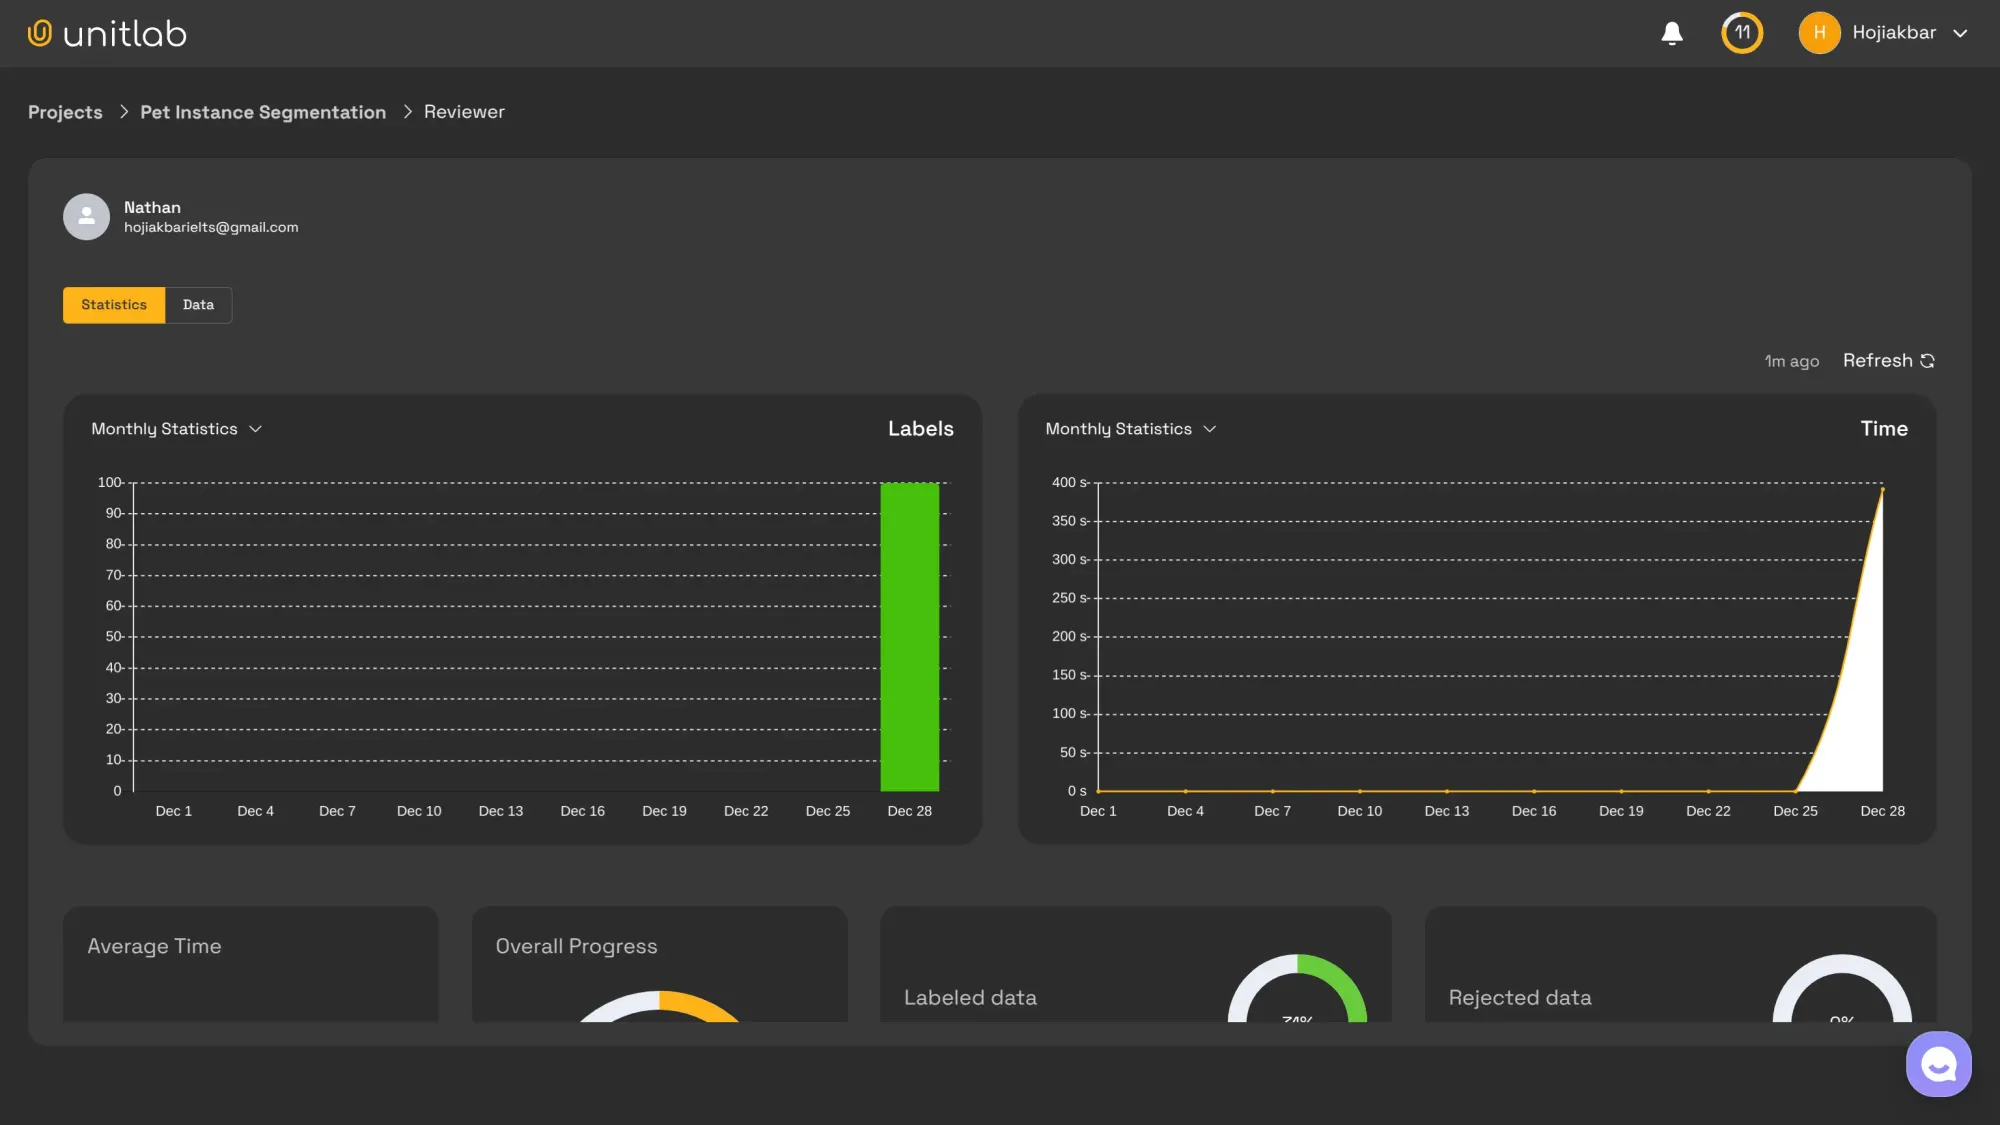
These metrics answer questions such as:
- Is this person performing consistently? (Github-like grids in Unitlab Annotate)
- How does their work stack up against others’?
- Are they spending too little or too much time on each task?
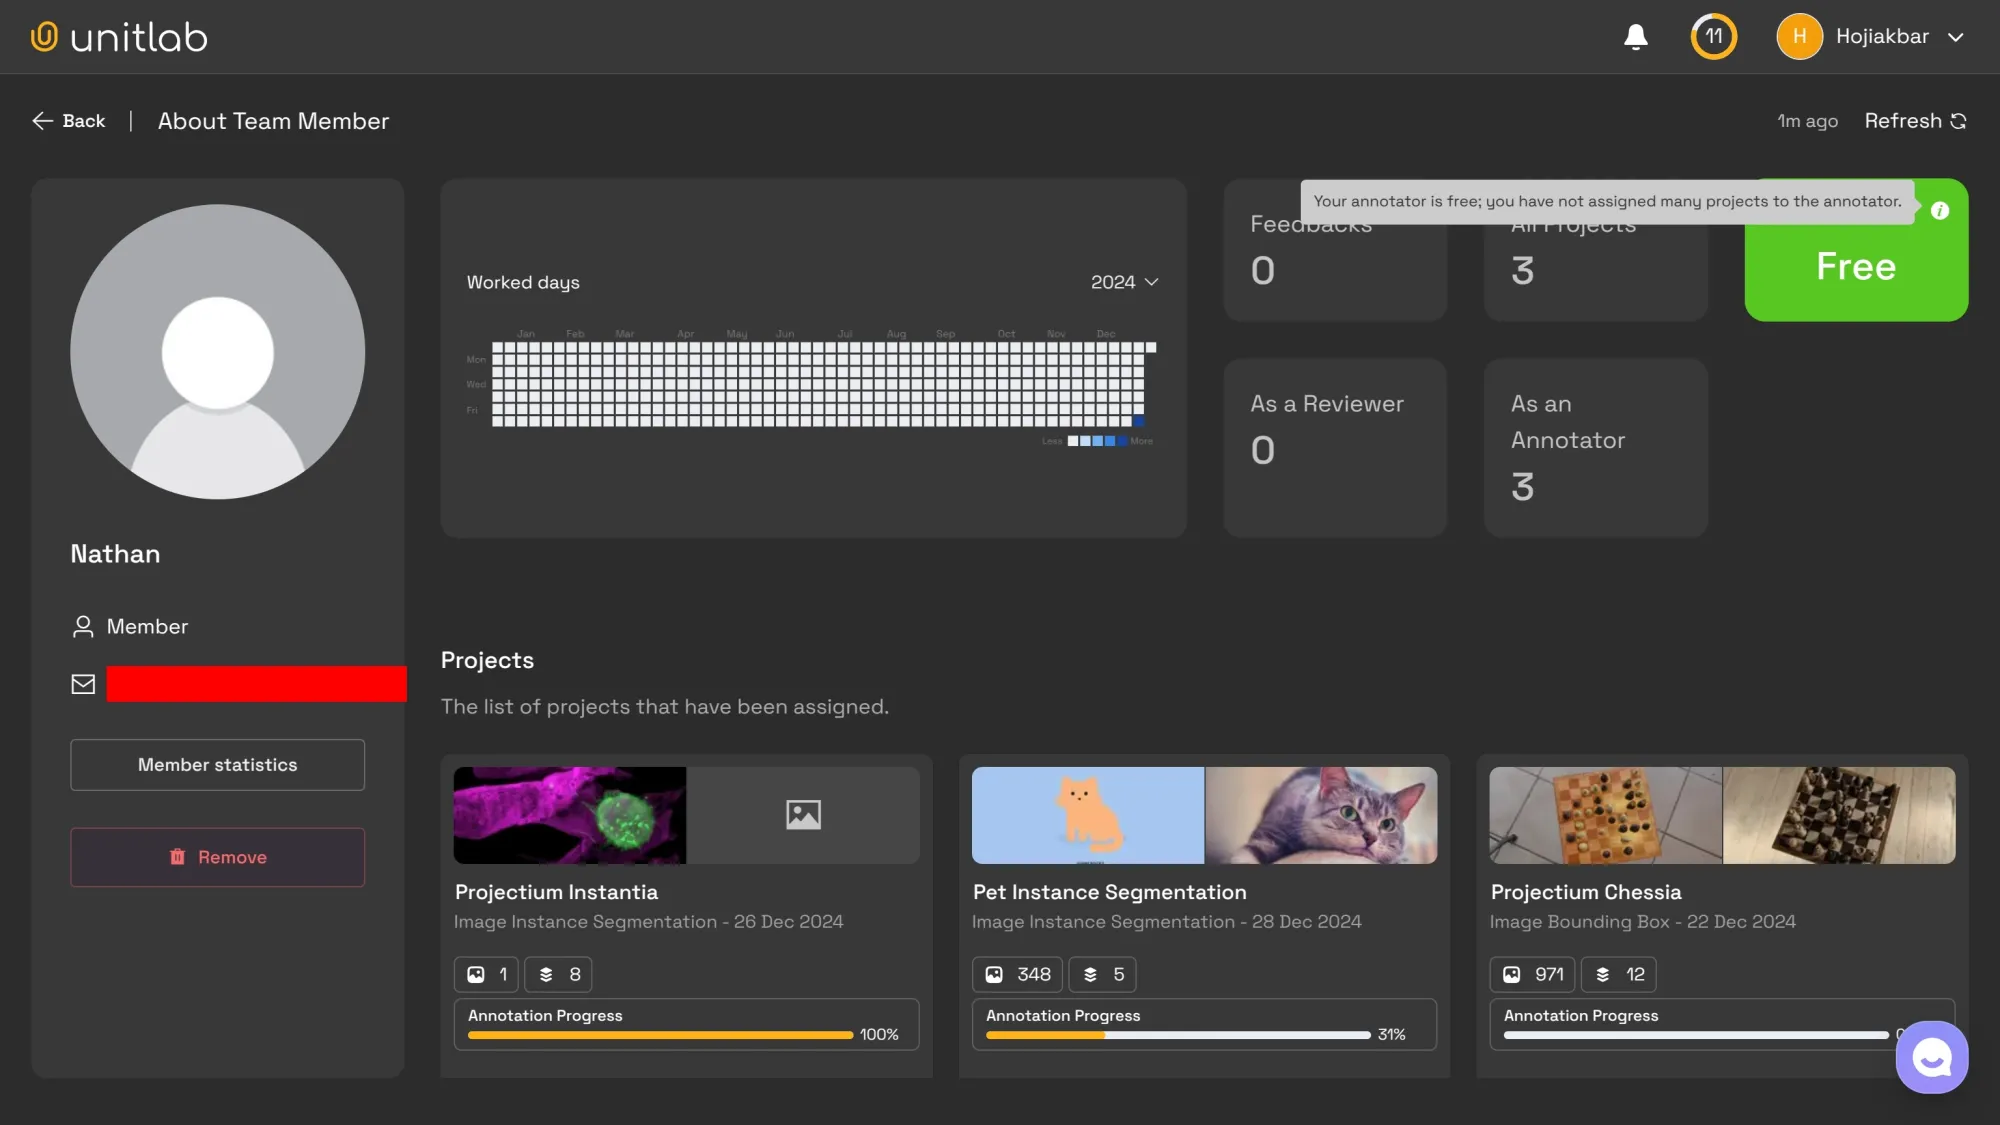
With project statistics providing the big picture and member statistics zooming in on individuals, it becomes easier to uncover issues such as uneven task allocation or inconsistent performance. Having both in your image annotation solution or data labeling tool ensures smoother, more efficient operations.
Key Features of Performance Analytics Tools
It’s clear that performance metrics are important, but you don’t want to drown in raw data. You need tools that help you cut through the noise. Here are some key features of a strong analytics platform:
Real-Time Dashboards
Dashboards are a fantastic feature; they show up-to-the-minute analytics on labels, time spent, and more. They’re also user-friendly, giving managers a quick snapshot of what’s happening right now.
A side benefit of real-time dashboards is accountability: most people perform better when they know they’re being watched. This lets you see who’s proactive and who might be slacking off a bit.
Historical Trends
While real-time dashboards focus on what’s happening now, historical dashboards give you a view of what’s been going on for weeks or months. Seeing these trends helps you handle day-to-day tasks while also keeping the broader project on schedule.
Role-Based Insights
In any labeling team, you’ll have people with different levels of expertise: senior, mid-level, and junior. Reviewers often have more experience than annotators because they check the latter’s work.
When the stakes are high, you only want the best annotators and reviewers on the job. Metrics per member help you figure out who fits where.
Maybe you hired 10 new annotators, and you can’t just throw them into the deep end. Someone needs to guide them. You could have a mid-level annotator serve as a reviewer for a small project to mentor these new hires.
Over time, you can track how they’re improving and whether the mentor can handle more responsibility. Similarly, you might test a senior annotator by having them manage a new project, which higher-level execs can then monitor.
Generating Insights with Performance Analytics
Collecting data is only half the story; turning that data into actual value is the real goal. Metrics can’t directly tell you why something happens, but they reliably show what’s happening. It’s up to project managers to interpret these numbers in context.
For instance:
- If approval rates drop, maybe the labeling guidelines aren’t clear, or the annotators need more training.
- If an annotator’s speed or quality suddenly drops, maybe they’re overwhelmed or missing key skills.
When you combine performance analytics with an understanding of your project environment, you can tailor solutions that improve quality, reduce churn, and maintain dataset management efficiency.
Conclusion
Project and member statistics are vital for tracking progress and keeping workflows efficient in your image labeling pipelines. Analytics won’t magically fix every issue, but they will shine a light on bottlenecks and help you stay aligned with your goals.
By using advanced analytics tools, like the ones in Unitlab Annotate, project managers can stay in control of labeling tasks, hit deadlines, and deliver top-notch datasets quickly. If you haven’t already embraced performance analytics, now’s the time to start. Give your project the direction and structure it needs to succeed.

