One of the most popular and practical tasks in computer vision is object detection. It identifies, classifies, and localizes objects within an image.
Every machine learning model has their own set of metrics to assess their prediction accuracy. In object detection, AP (Average Precision) and IoU (Intersection over Union) are common metrics. In this article, we will cover IoU.
IoU is an essential metric because it gives a numerical value for how well the object detection model distinguishes objects from their backgrounds in an image. In other words, IoU measures the amount of background noise in object detection. This metric is widely used in computer vision applications, such as self-driving cars, retail, and security systems.
In today's post, we will cover:
- What is IoU?
- How to calculate IoU?
- Getting Ground-Truth data?
- IoU Thresholds and Extensions
- Common mistakes in object detection
- How to improve IoU?
What is IoU?
Intersection over Union is a popular metric to measure localization accuracy and errors in object detection models. This metric calculates the amount of overlapping between two intersecting bounding boxes: a predicted bounding box and a ground-truth box.
The ground-truth box refers to the most accurate bounding box that fully captures the object without any excess background noise.
IoU follows Jaccard's index: a statistic used for gauging the similarity and diversity of sample sets. It is defined in general taking the ratio of two sizes (areas or volumes), the intersection size divided by the union size.
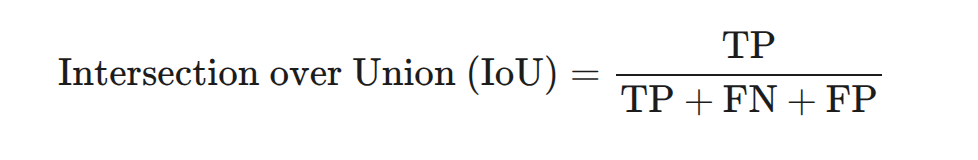
Mathematically, it is written as:
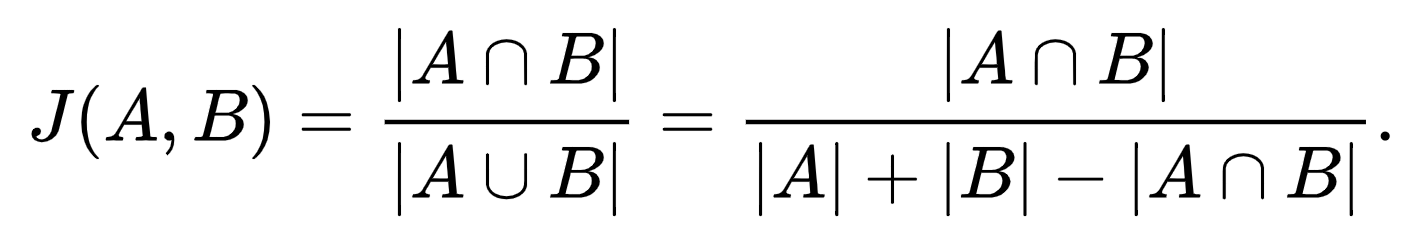
Intuitively, the IoU will be high if there is much overlap between the predicted and ground-truth bounding box. The more the overlap, the higher the accuracy. The IoU can go from 0 to 1; a score of 1 means a perfect match, while the IoU of 0 indicates there is no overlap between the two boxes.
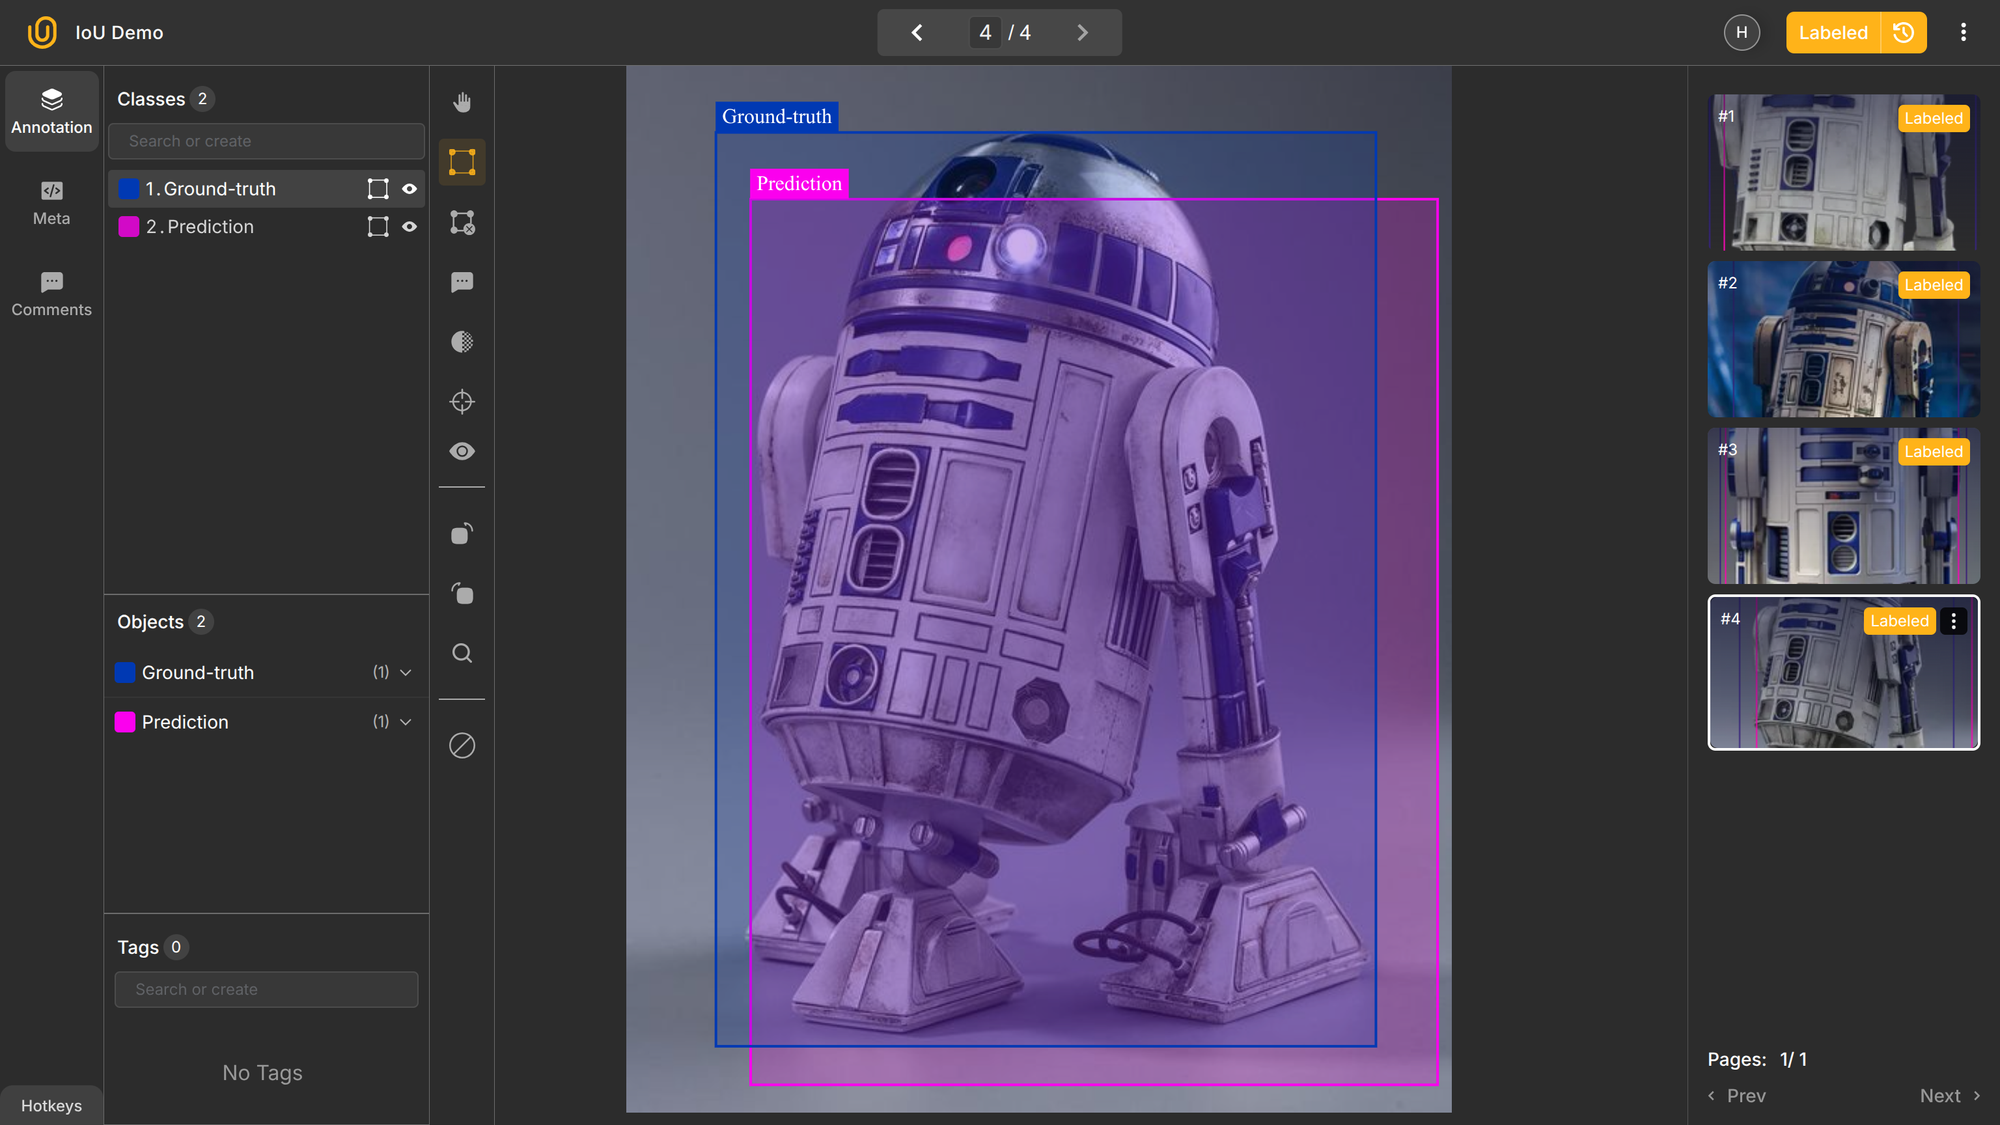
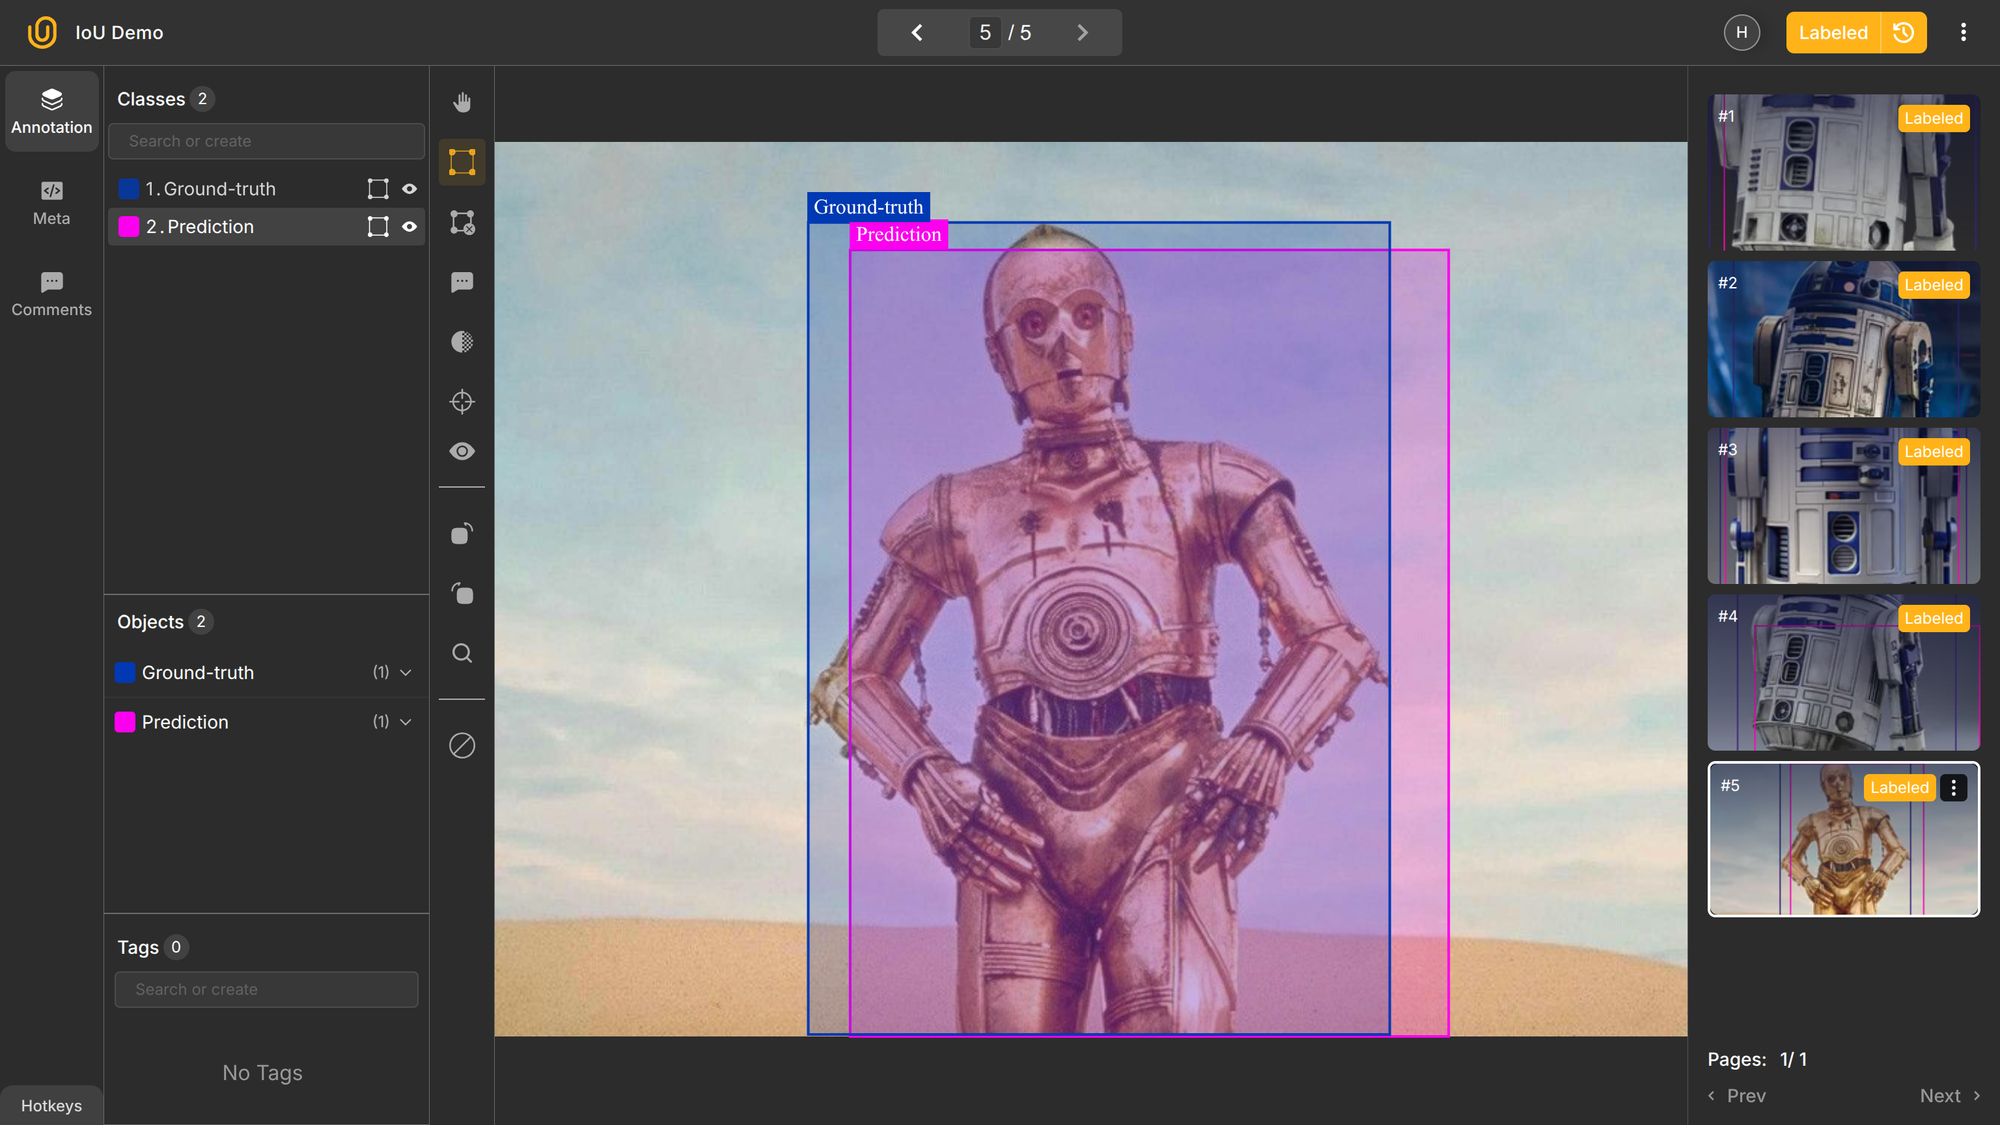
To illustrate IoU, imagine we have an object detector that can identify and localize robots in an image. The anticipated bounding box for the robot can and will likely differ from the "real" ground-truth box. To assess its accuracy, we will use its IoU:
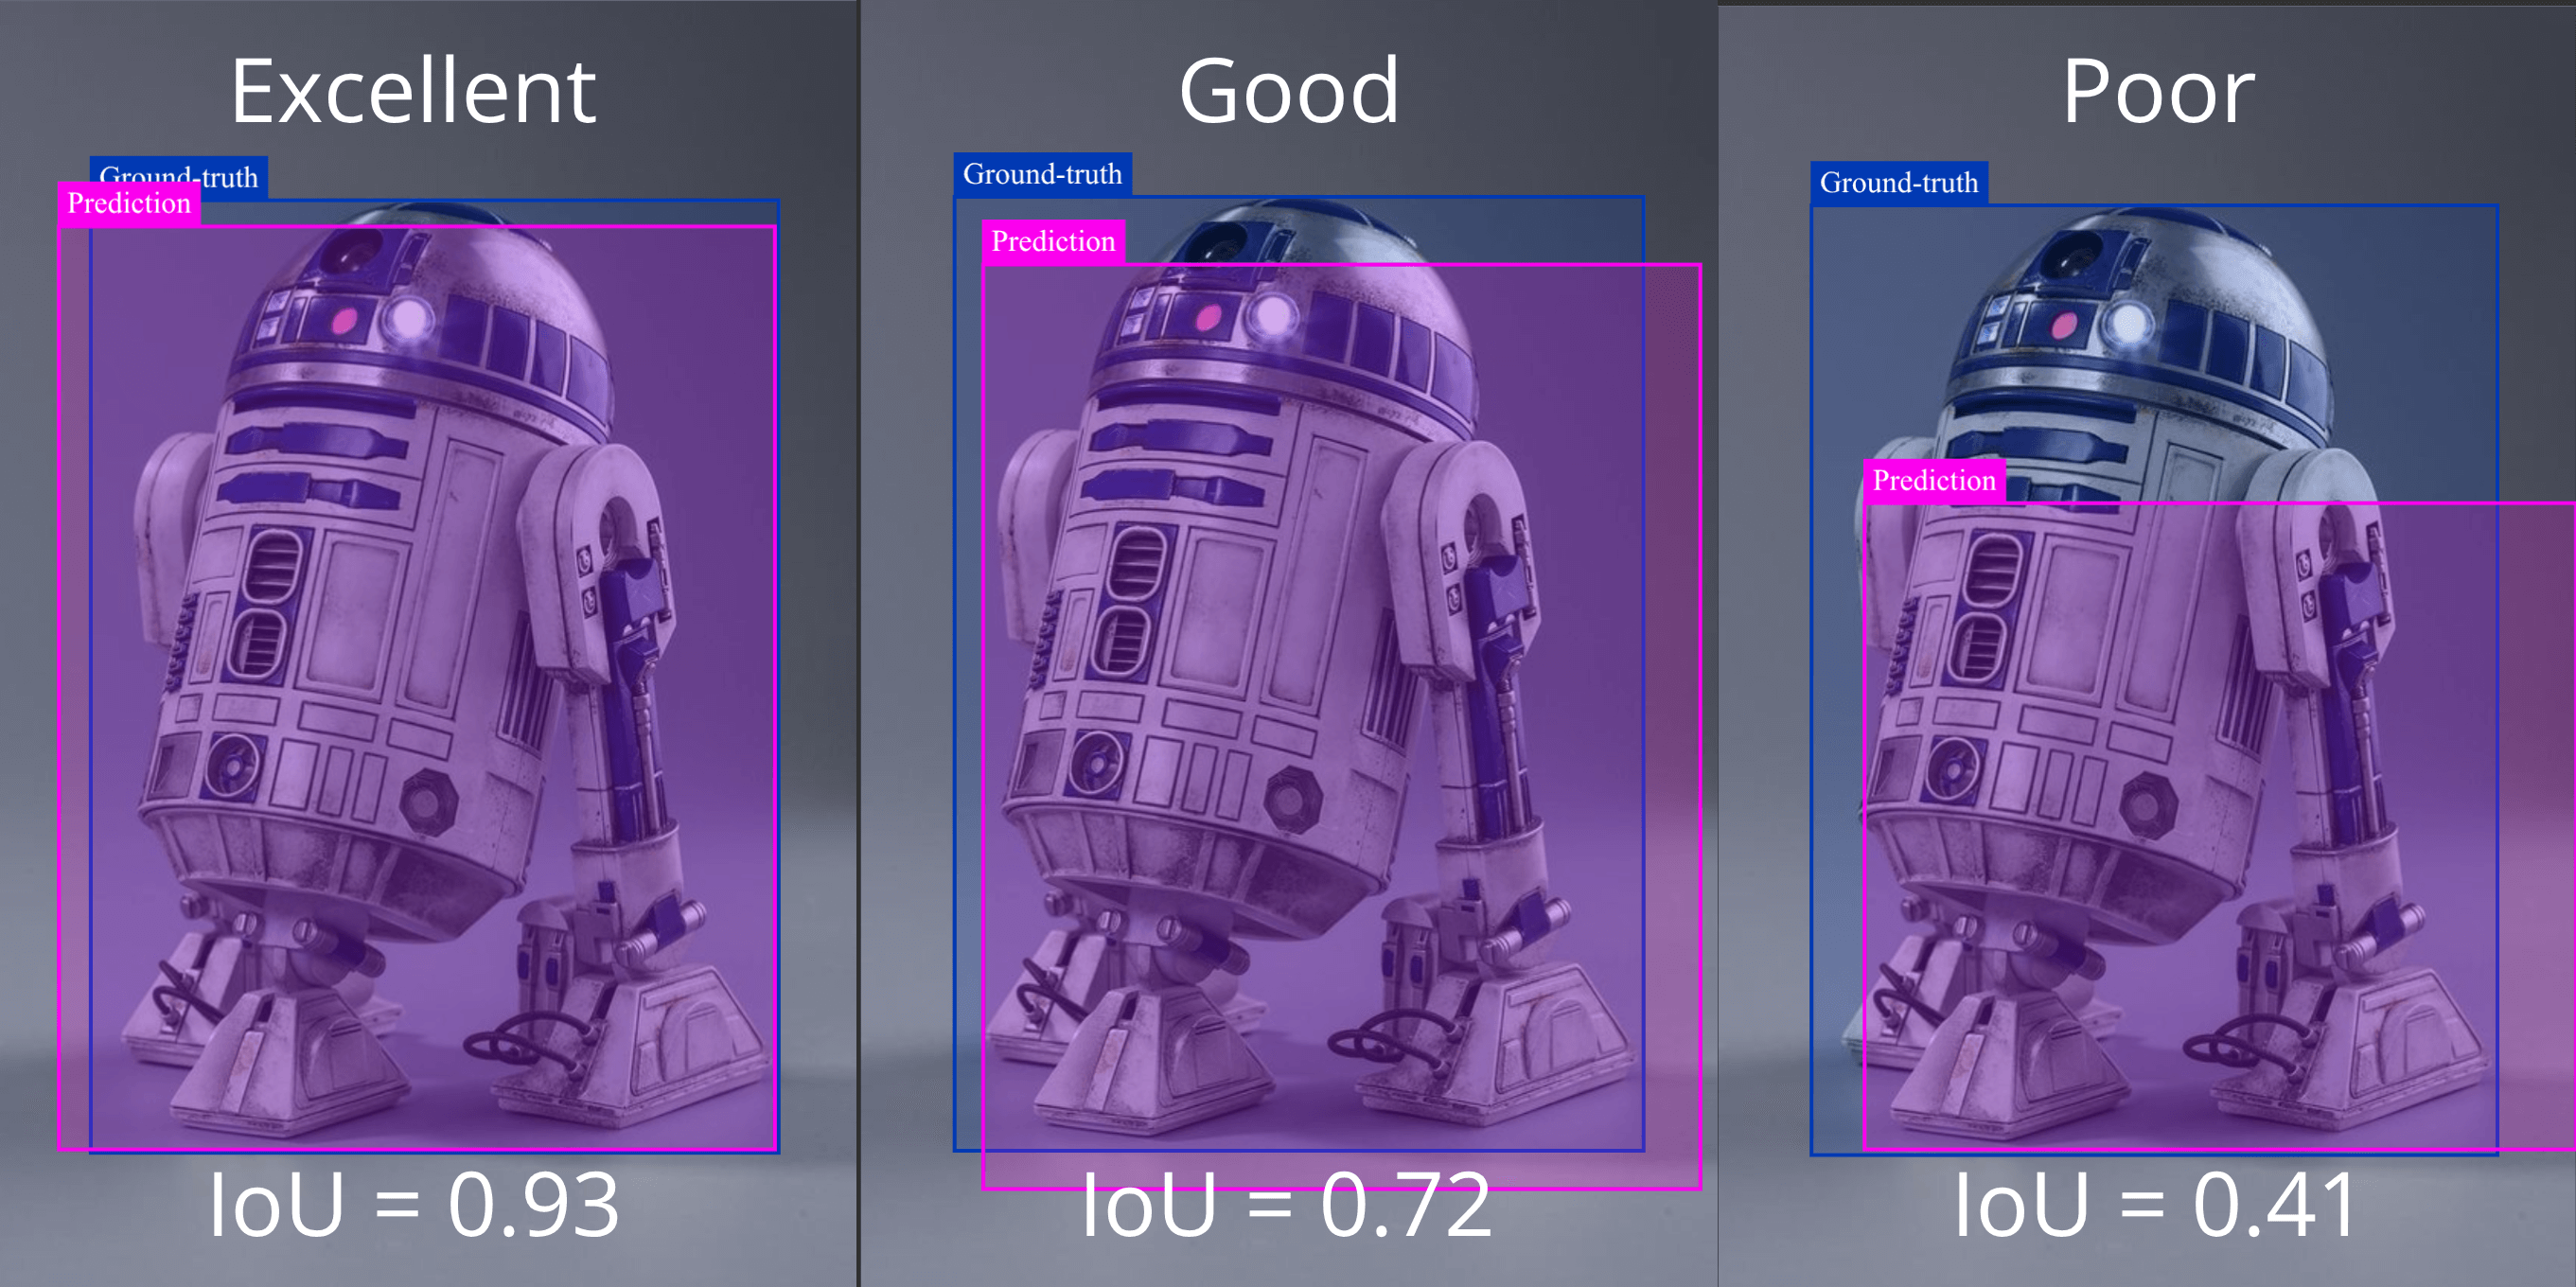
In the image above, the robot, R2D2 from StarWars, is annotated by the model, and the IoU is calculated for each instance. A high IoU score of 0.93 indicates two boxes almost perfectly match. In the second picture, an average model would produce a good IoU score of 0.72, while a computer vision model of low accuracy would produce a poor IoU of only 0.44.
Essentially, IoU is a statistical metric of how well an object detection/computer vision model is performing.
How to calculate IoU?
IoU is a statistical metric that shows the amount of overlap between two bounding boxes, a predicted and actual one. This measure is derived from the set theory in mathematics.
In general, you compute IoU as:
IoU = Area of Intersection / Area of Union
Here are the broad calculation steps:
- find overlap between predicted and true boxes
- calculate its area
- calculate the area covered by both boxes combined
- divide the first by the second
For example: If the intersection area is 4,200 and the union area is 8,400, IoU = 0.5. Two boxes that do not overlap have an IoU score of 0, while two perfectly matching boxes will have an IoU score of 1 because they fully overlap each other. Therefore, this metric always ranges from 0 (no overlap) to 1 (perfect match).
Because we are dealing with rectangles in an image, it is easy to write a formula and code to quickly figure out the IoU score. Let's look at the mathematical derivation first using this example:
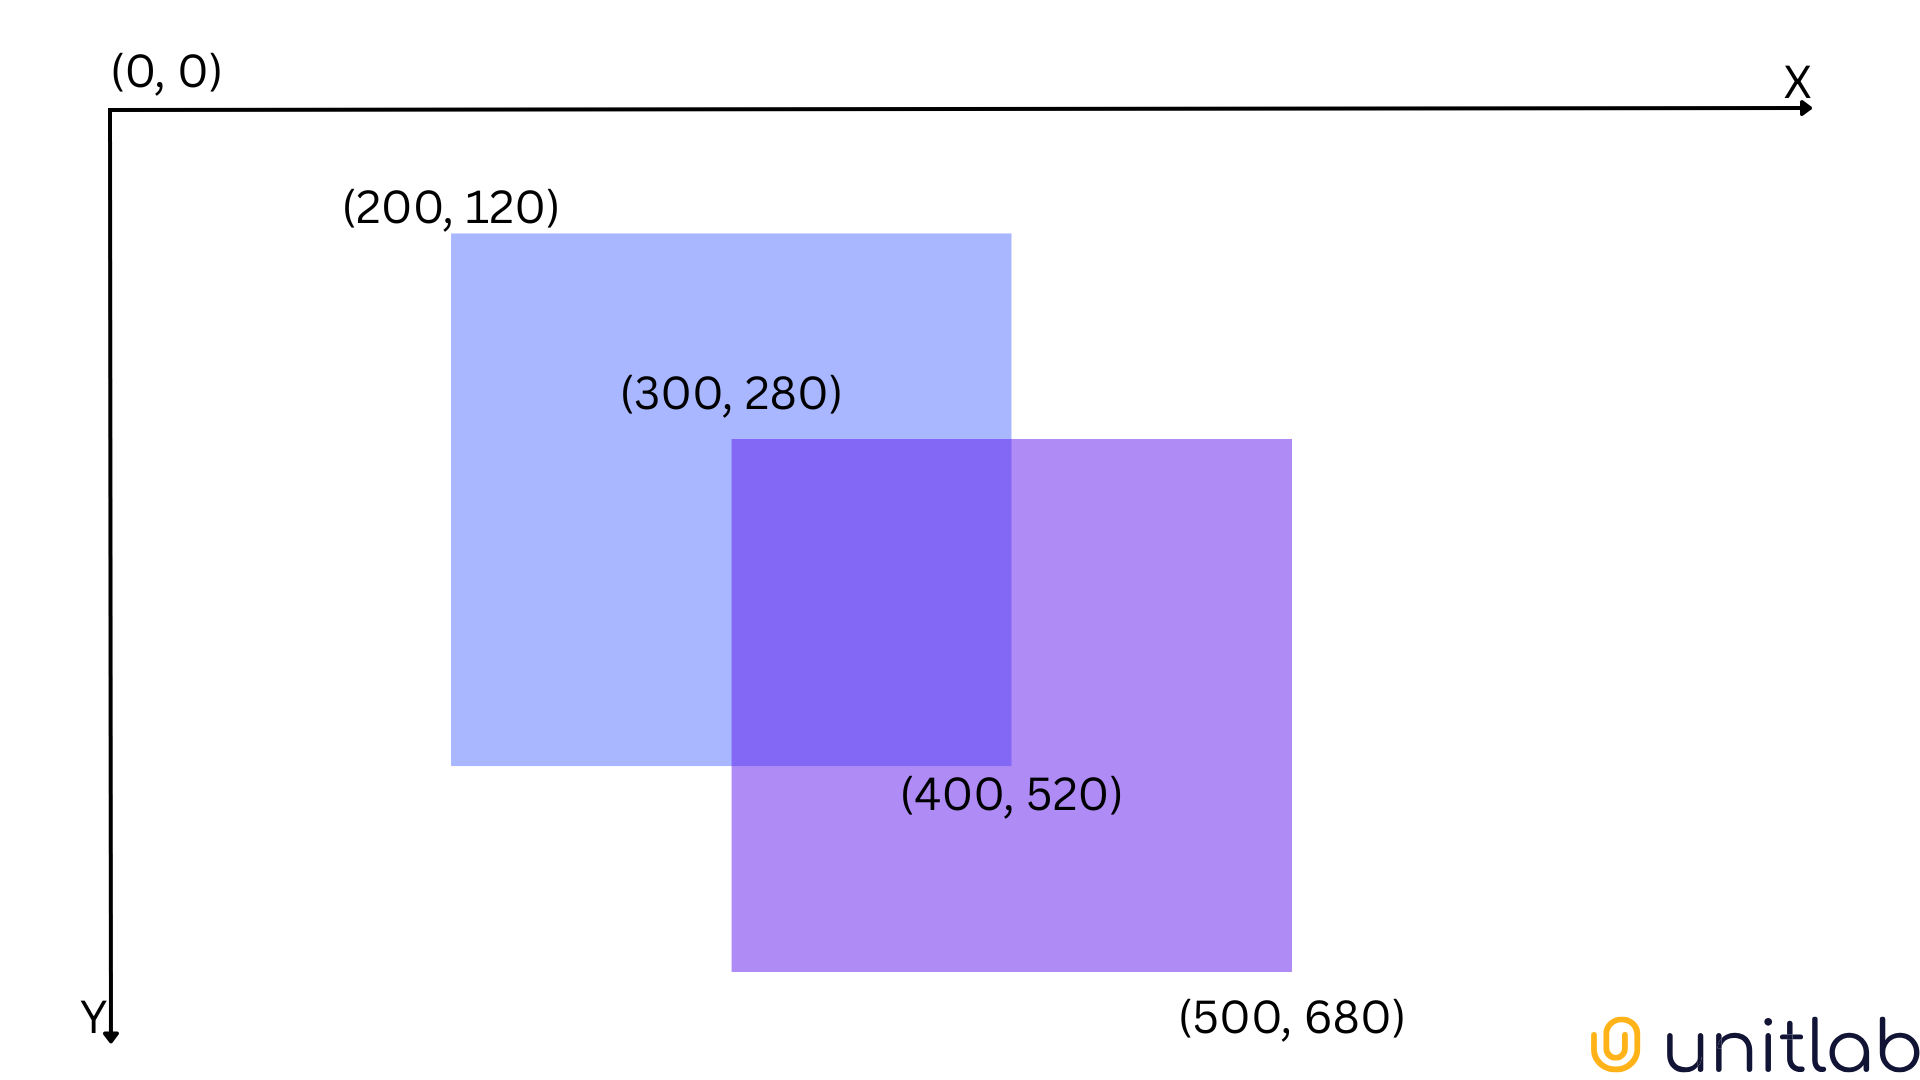
First, we need coordinates for the top-left and bottom-right corner of each box, X and Y. Let's denote them as
X = [A1, B1, C1, D1] = [200, 120, 400, 520]
Y = [A2, B2, C2, D2] = [300, 280, 500, 680]
To find the overlap between the predicted and ground-truth boxes, we need the coordinates for maximum top-left corner and minimum bottom-right corner because of how coordinates work within images. (0,0) stands for the top-left corner.
Therefore, our overlapping box will have these coordinates:
A = max(A1, A2) = max(200, 300) = 300
B = max(B1, B2) = max(120, 280) = 280
C = min(C1, C2) = min(400, 500) = 400
D = min(D1, D2) = min(520, 680) = 520
Before we go further with our calculations, we need to make sure that two bounding boxes actually intersect. To determine this, we compare that both A < C and B < D hold true. In our case, it does.
Now, we know the coordinates of the intersecting box, we can find its area, the areas of X and Y, and the total area by using the standard rectangle area formula, S=wl:
|X∩Y| = (400 - 300) * (520 - 280) = 24000
|X| = (400 - 200) * (520 - 120) = 80000
|Y| = (500 - 300) * (680 - 280) = 80000
|X∪Y| = |X| + |Y| - |X∩Y| = 80000 + 80000 - 24000 = 136000
Now, the IoU score for our image becomes 24000/136000 = 0.18, suggesting the object detector performed very poorly.
Knowing the logic behind this, we can write Python code for calculation:
class Box:
	'''
	Initializing Box class
	'''

    def __init__(self, left, top, right, bottom):
        self.left = left
        self.top = top
        self.right = right
        self.bottom = bottom


box1 = Box(200, 120, 400, 520)
box2 = Box(300, 280, 500, 680)


def calculate_iou(box1, box2):
    # Calculate overlap area
    overlap_width = min(box1.right, box2.right) - max(box1.left, box2.left)
    overlap_height = min(box1.bottom, box2.bottom) - max(box1.top, box2.top)

    if overlap_width <= 0 or overlap_height <= 0:
        return 0

    overlap_area = overlap_width * overlap_height

    # Calculate union area
    box1_area = (box1.right - box1.left) * (box1.bottom - box1.top)
    box2_area = (box2.right - box2.left) * (box2.bottom - box2.top)

    union_area = box1_area + box2_area - overlap_area

    # Calculate IoU
    iou = overlap_area / union_area
    return iou


print(calculate_iou(box1, box2))  # 0.176
Where to get Ground-Truth data?
Up until this point, we have assumed that we have ground-truth bounding boxes. Ground-truth refers to the actual/accurate values of the evaluated object or area. Then, we use this data to evaluate our predictions.
In our object detection case, the ground-truth data would be the precise rectangle surrounding robots in an image. Usually, human experts manually mark these actual boxes.
In other computer vision tasks such as semantic or instance segmentation, the same logic applies. We find the area/number of correctly annotated objects and divide by the total. Even for binary classification tasks, we use the same intersection over union set concepts to derive this formula:
Whatever the computer vision task, we need accurate ground-truth data to gauge the accuracy of our model. Here's a broad set of steps of preparing ground-truth information and finding IoU:
- Collect the dataset
- Annotate the dataset
- Save the coordinates of the bounding boxes
- Split the dataset into training, testing, and validation
- Train your model and run it on the testing dataset
- Compare the results.
IoU Thresholds
Additionally, while training your model, you can choose a minimum IoU score needed for a predicted box to be regarded as an accurate positive detection, which allows using IoU to set a threshold for object detection. You can manage the trade-off between detection accuracy and false positives by choosing the suitable threshold.
IoU scores run from 0 to 1. You can choose a minimum IoU score needed for a predicted box to be regarded as a true positive while training and annotating your images. This threshold specifies the trade-off between detection accuracy and false positives.
For example, in Unitlab Annotate, you can configure the minimum IoU threshold for foundational models and models you integrate to the platform, along with other additional model configurations:
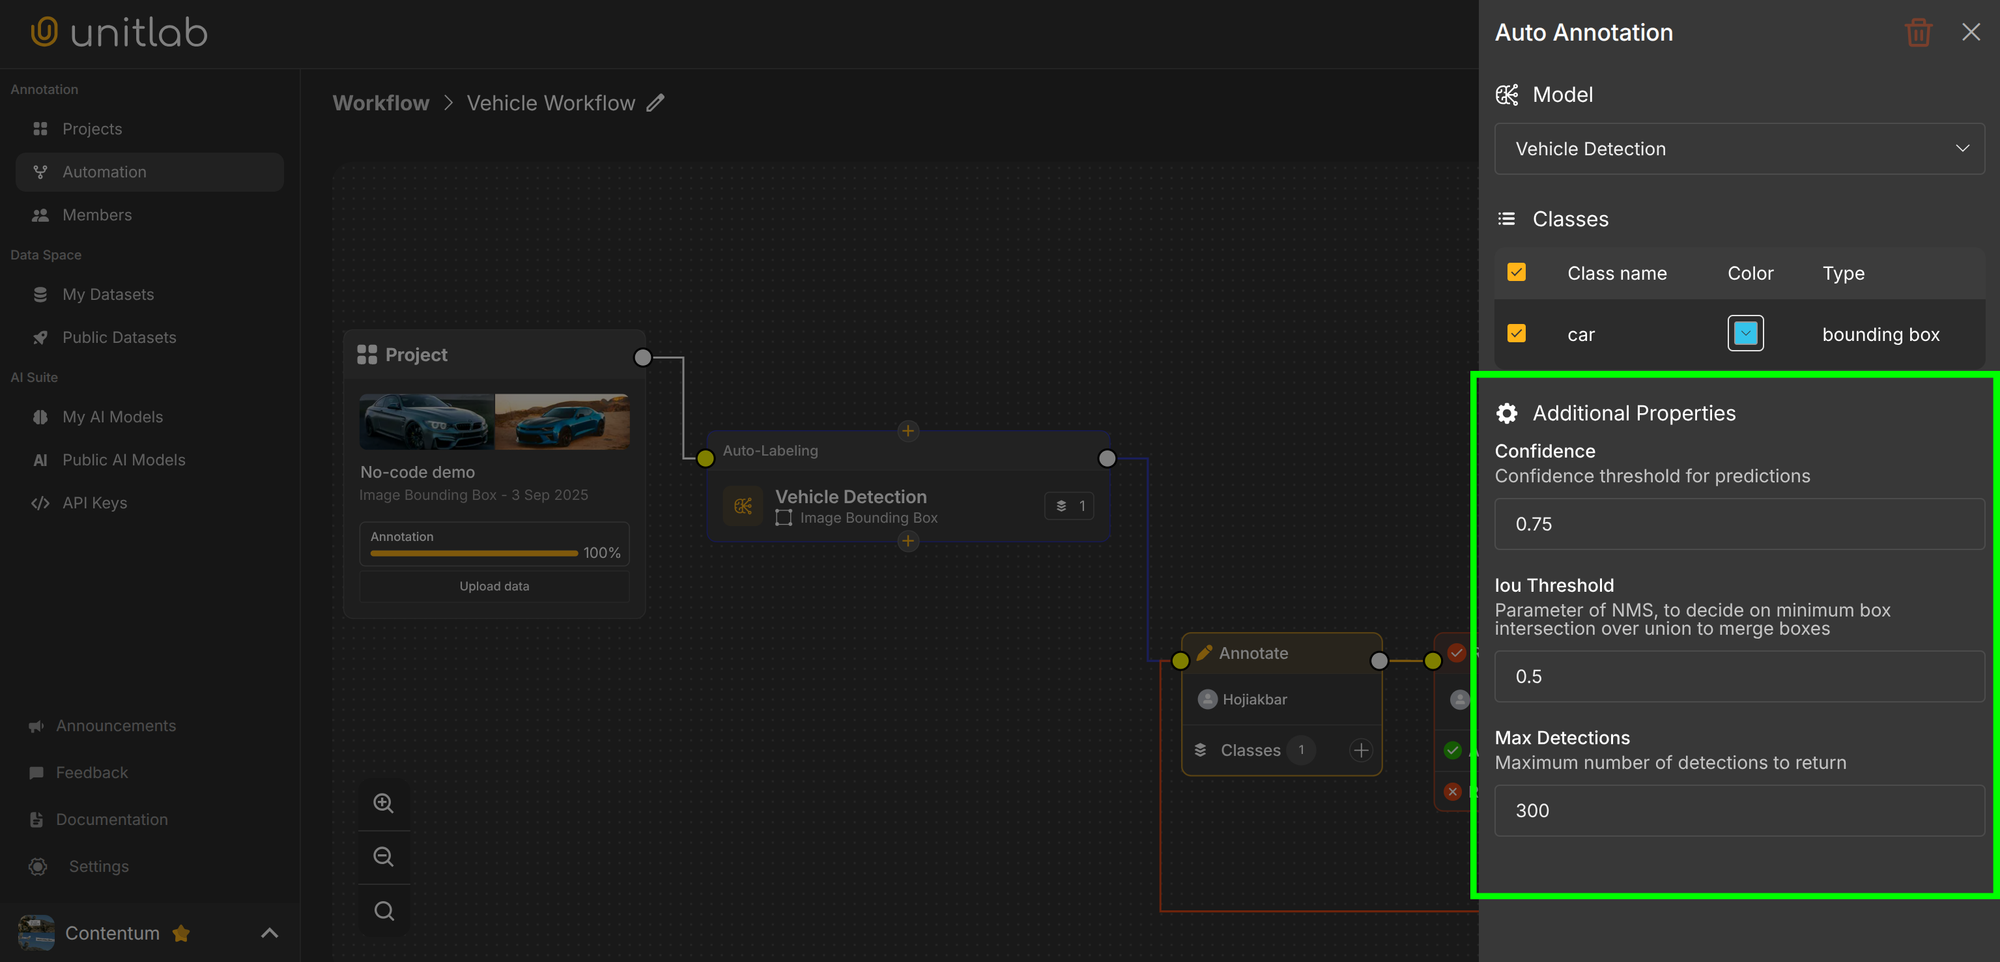
You pick thresholds based on the strictness you need. Tighter thresholds reduce false positives but demand more accurate boxes. Common values include:
- 0.3 for fast but coarse detection
- 0.5 for general detection tasks
- 0.75 for high-precision work
Generally, 0.5 is considered a good "rule of thumb" score for bounding boxes in computer vision. However, this threshold changes depending on the task and industry. Obviously.
Variants and Extensions of IoU
So far, we had an underlying assumption that the predicted and actual boxes cross. Standard IoU breaks down when boxes do not intersect. In this case, the IoU score will be 0, which is actually not that useful on its own.
When boxes do not intersect, IoU cannot tell the distance between two boxes or the directions to move the predicted box.
This leads to extended metrics over Intersection over Union:
- GIoU (Generalized IoU) considers distance between boxes
- DIoU (Distance-IoU) penalizes center distance
- CIoU (Complete-IoU) adds DIoU and aspect-ratio consistency
These measures help models understand the localization better and improve their accuracy. However, they are all built on IoU and used in specific use cases:
- Use GIoU when boxes often don't overlap early in training.
- Use DIoU when center alignment is important.
- Use CIoU when center, distance, and aspect ratio all matter (most common in YOLOv5+).
IoU: Mistakes and Fixes
In object detection, there are several mistakes that happen in almost every dataset that reduce the accuracy of computer vision models, and IoU consequently. We have compiled the list of problems from most common to less common. By fixing those problems, you can significantly improve IoU.
Keep in mind, however, we are here specifically referring to the problems that happen during data annotation. If your original dataset is biased, not properly sampled, not diverse enough, and/or of low quality, then fixing a low IoU is pointless. You may develop a very accurate object detection that no one needs in the real world.
Therefore, if your dataset has problems, fix them first. You can follow the advice below to build an accurate computer vision model, but it's hard to recover from a radically inferior starting point.
So, here are most common mistakes in object detection that reduce IoU:
- boxes that do not fully cover the object
- clipping important parts
- insufficient handling of occluded objects
- duplicate predictions over the same object
- confusing similar classes
- inconsistent aspect ratios across labels
We have written an entire guide on labeling your images accurately before here.

7 Tips for Accurate Image Labeling
To fix common mistakes, keep these rules in mind:
- label objects in their entirety
- give annotators clear rules
- keep boxes aligned with object edges
- use the same tool for all tasks
- use auto-annotation tools to pre-label and correct manually
Conclusion
IoU is a numerical measure that tells you how well a predicted region matches the true region in computer vision. It is derived from the set theory by dividing the area of intersection by that of union.
IoU is a popular, consistent metric to measure model quality, evaluate predictions, and maintain dataset consistency.
IoU is derived from the set theory. Because it is based on the ratio between intersection and union, we need to find the area of intersection and union. This varies based on the task (bounding boxes, segmentation areas, binary classification), but the same logic applies everywhere.
IoU has its limitations though; it is not very useful when the predicted bounding box does not intersect with the ground-truth box. In this case, we can use its extensions: GIoU, DIoU, CIoU depending on the specific need.
Finally, there are several common mistakes during data annotation that reduce IoU and our model's accuracy. Fortunately, there are best practices available for you to fix them so that you will have a performant, accurate, useful computer vision model.
Explore More
Check out these articles for more on object detection and computer vision models:
- Dive into Confusion Matrix and F1 Score
- Guide to Object Detection with a Python Demo [2026]
- Bounding Box Essentials in Data Annotation with a Demo Project
References
- Adrian Rosebrock (Nov 07, 2016). PyImageSearch: Source
- Deval Shah (May 30, 2023). Intersection over Union (IoU): Definition, Calculation, Code. V7 Labs: Source
- Vineeth S Subramanyam (Jan 17, 2021). IOU (Intersection over Union). Medium: Source