

Precision is absolutely essential when judging computer vision models. How precise is a particular model, and how effectively does it handle the task at hand? To gauge performance, we use several metrics, especially the confusion matrix and the F1 score. These evaluation techniques are fundamental in the broader field of data science and artificial intelligence, where proper model evaluation ensures reliable and accurate results.
Both metrics are tailored for binary classification tasks, where the model decides between “Yes” and “No.” For instance, an email might be spam or legitimate, a tumor might be harmful or benign, and a vehicle might break parking regulations or remain compliant.
Having these two outcomes means the confusion matrix not only shows the total accuracy but also pinpoints how the model makes mistakes. Picture it as a coin: one side shows how accurate the model is, and the other side details its errors. Meanwhile, the F1 score offers a single measure that captures both precision and recall.
By the time you finish reading, you will understand:
- Confusion Matrix in the context of email spam detection
- True Positive, True Negative, False Positive, and False Negative
- Accuracy, Precision, Recall, and Specificity
- The F1 Score
- The role of model evaluation in data science and artificial intelligence
Confusion Matrix
A confusion matrix is a simple 2×2 table that measures how well a binary classification model performs. The confusion matrix represents the predictive performance of a model by breaking down the counts of true positives, false positives, false negatives, and true negatives.
Instead of only telling you how many predictions are correct, it breaks them down into true positives, false positives, false negatives, and true negatives.
For email spam detection, the confusion matrix looks like this:
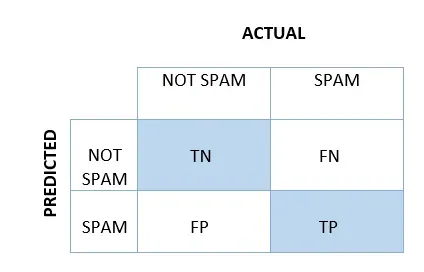
True Positive (TP): The model accurately flags spam emails as spam.

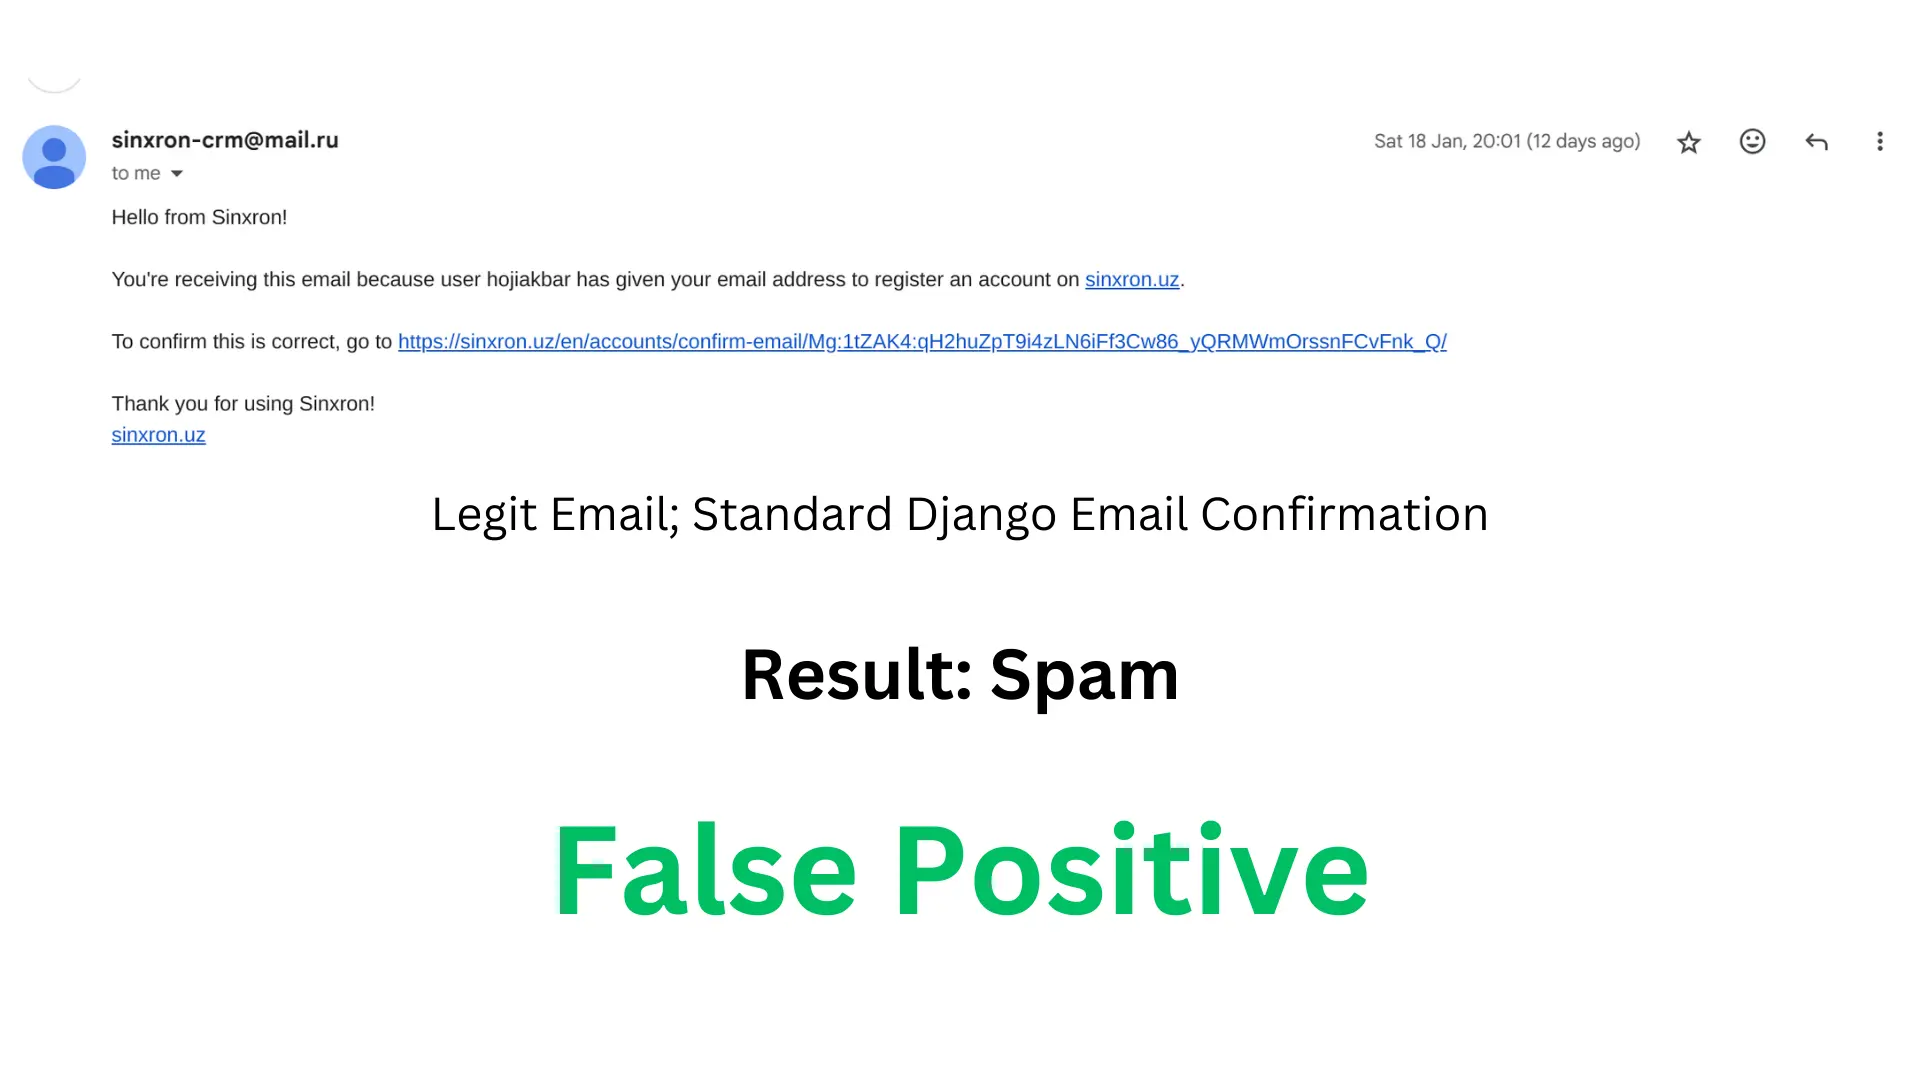
False Positive (FP): The model wrongly marks a legitimate email as spam.
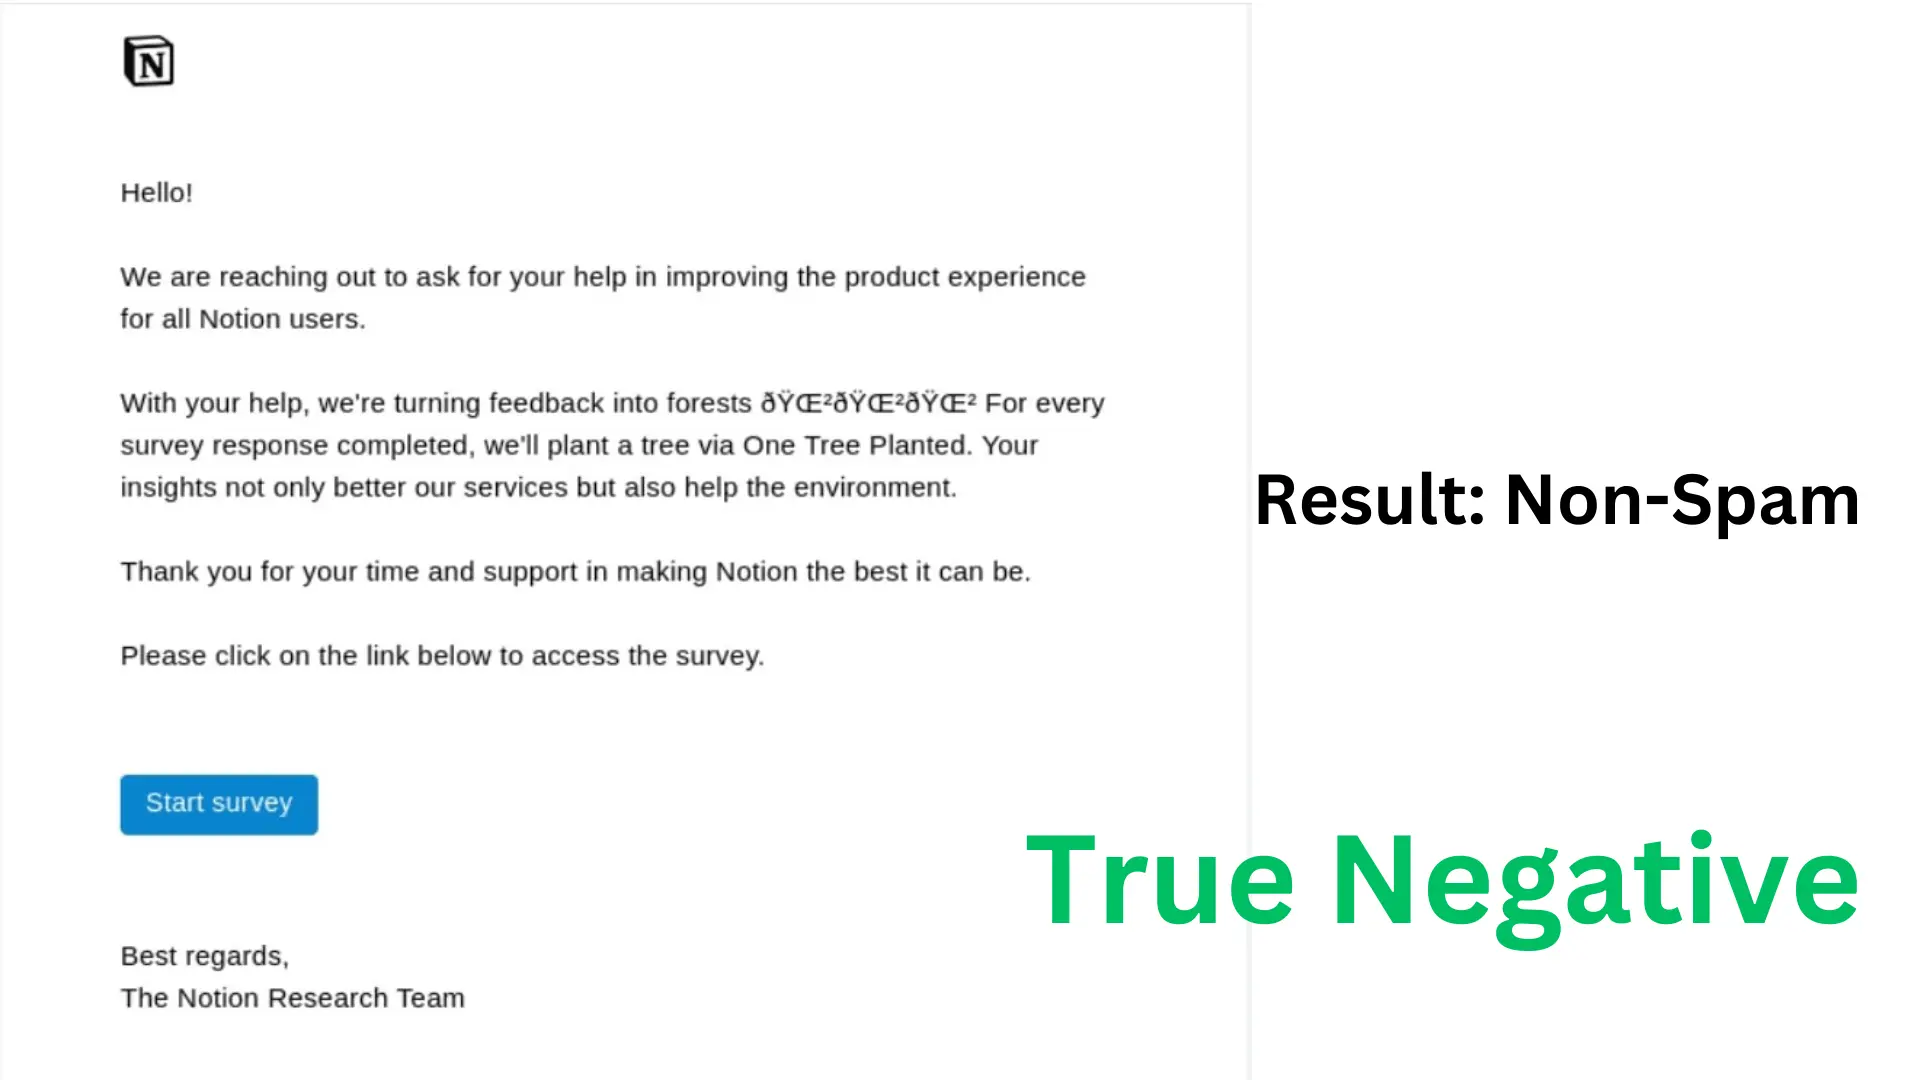
True Negative (TN): The model accurately identifies a legitimate email as legitimate.
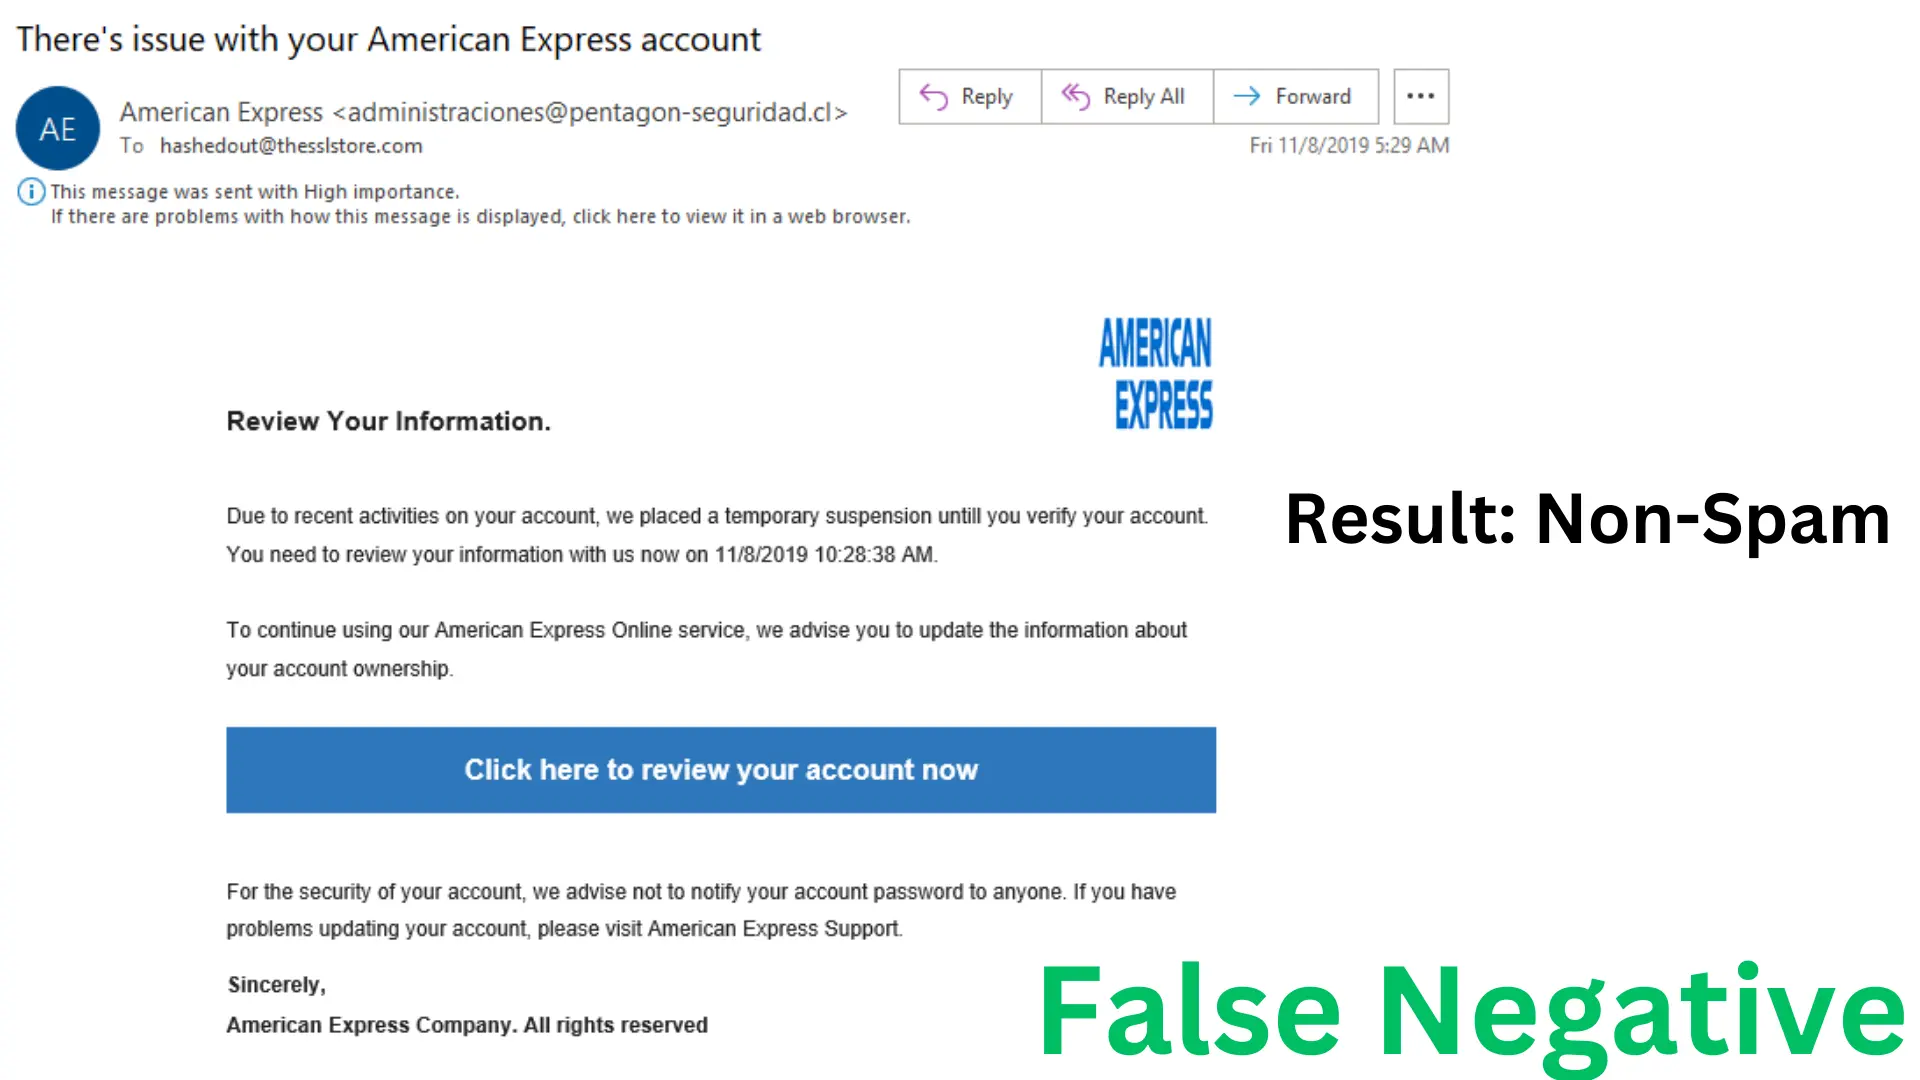
False Negative (FN): The model overlooks a spam email and labels it as legitimate.
Understanding these four outcomes is vital for calculating the performance metrics discussed next.
Let’s, for the sake of example, we run our AI model and get these results:

We can see that we had 100 emails, 80 legitimate and 20 spam. Our model classified them according to the table. Now, we can run different analyses to find out how well our model is doing.
Key Metrics Derived from the Confusion Matrix in Machine Learning
From TP, FP, FN, and TN, we can compute several important metrics, known as evaluation metrics, that run from 0 to 1, with 1 being perfect. These metrics, including accuracy measures, precision measures, recall measures, and other metrics, are crucial for assessing model performance, especially in cases of imbalanced datasets.
In an ideal world, each metric would be close to 1, signifying a highly effective model. The confusion matrix allows you to see all the predictions and how they are classified as true positives, false positives, true negatives, and false negatives. The positive class and negative class play key roles in the matrix, representing the target and non-target outcomes, respectively.
Accuracy
\[\text{Accuracy} = \frac{TP + TN}{TP + TN + FP + FN}\]
- Our Accuracy: (75+15)/(75+5+15+5) = 90/100 = 90%, a high accuracy score.
- Our model is, in general, accurate.
- Accuracy is an accuracy measure that reflects the proportion of correct classifications out of all the predictions made. It is mathematically defined as the ratio of correct classifications (true positives and true negatives) to all predictions.
- Accuracy shines in datasets where the positive and negative classes are fairly balanced.
- In imbalanced datasets, accuracy alone can be deceptive. For example, if 95% of samples fall under one class, always predicting that class yields 95% accuracy but offers little practical value.
Precision
\[\text{Precision} = \frac{TP}{TP + FP} \]
- Our Precision: 75/(75+5) = 75/80 = 93.75%, a very high precision.
- Precision is a precision measure that evaluates the proportion of correctly identified positive cases (true positives) among all positive predictions. It is especially important when the cost of false positives is high.
- Most of the emails that are not spam are actually classified as non-spam.
- Precision matters most where false positives are expensive, such as fraud detection or spam filtering.
Recall
\[\text{Recall} = \frac{TP}{TP + FN} \]
- Our Recall: 75/(75+5) = 75/80 = 93.75%, a very high recall.
- Recall is a recall measure, also known as the true positive rate, that quantifies the proportion of actual positives (positive cases) that are correctly identified by the model. It is crucial for understanding how well the model detects positive cases, especially in high-stakes scenarios.
- Most of the emails that the model classified as non-spam are actually not spam.
- Recall is essential where missing a positive case has severe consequences, like in diagnosing diseases or detecting security breaches.
All these metrics are mathematically defined based on the confusion matrix, providing a rigorous framework for evaluating model performance.
F1 Score as the Harmonic Mean of Precision and Recall
One major drawback of depending solely on accuracy is that it can distort performance in imbalanced datasets, where one class is much larger than the other. In such cases, class imbalance can make both accuracy and F1 score less reliable, as the metrics may not reflect the true effectiveness of the model across all classes. For instance, in spam detection, legitimate emails typically outnumber spam by a significant margin.
Imagine a dataset with 90 legitimate emails and 10 spam emails. A model labeling all 100 as legitimate reaches 90% accuracy but catches no spam at all, making it practically ineffective. Such cases highlight how class imbalance can lead to misleading accuracy results and why alternative metrics are necessary.

To tackle this limitation, data scientists frequently use the F1 Score, which is the harmonic mean of precision and recall. The F1 Score is a balanced F score that equally weighs precision and recall, making it especially important for evaluating model performance and predictive performance in the presence of class imbalance.
It’s better suited for situations with uneven class distributions. The F1 Score goes from 0 to 1, hitting 1 only if both precision and recall are perfect. The calculation of F1 score relies on positive predictions, as it considers the proportion of correctly identified positive cases among all predicted positives and actual positives.
Although an ideal score is rare, data scientists (when evaluating machine learning models) aim to get as close to 1 as possible, taking into account the number of data points in each class.
\[\text{F1 Score} = 2 \ast \frac{\text{Precision} \ast \text{Recall}}{\text{Recall}+\text{Recall}}\]
Our F1 Score then becomes = 2 * (0.9375 * 0.9375) / (0.9375 + 0.9375) = 0.9375.
This means that our model is in general effective at detecting spam emails. The F1 score provides a measure of overall performance and, in multi-class or imbalanced scenarios, can be calculated as a weighted average to account for class imbalance.
When calculating F1 score across multiple classes, the average parameter can be used to aggregate scores, allowing for micro, macro, or weighted averaging depending on the distribution of data points and the evaluation needs.
However, to evaluate model performance, it is essential to compare the true labels (the actual class) with the predicted labels (the class the model predicted). The number of correctly predicted instances, where the predicted label matches the true label, directly impacts metrics like accuracy, precision, recall, and F1 score.
Example: Fraud Detection and the Positive Class
- High precision lowers the risk of tagging legitimate users as fraudsters, emphasizing the importance of the precision metric in evaluating model performance.
- High recall decreases the chances of overlooking actual fraudulent activities, highlighting the role of the recall metric in minimizing false negatives.
- The F1 Score finds a balanced midpoint between these factors. The F1 score balances either precision or recall depending on the application, making it useful when you need to optimize for both metrics in scenarios like fraud or disease detection.
Use Cases
- For balanced datasets, accuracy usually works well.
- For cancer screening, recall is crucial: missing even a single positive can be dangerous.
- In spam detection, precision is vital: misclassifying key emails as spam is problematic.
- In many real-world applications, the F1 Score is prized for balancing both precision and recall.
Conclusion
Although the confusion matrix offers a thorough breakdown of predictions, the F1 Score combines precision and recall into one convenient metric:
- Choose accuracy for balanced data.
- Focus on precision when false positives have serious consequences.
- Emphasize recall when false negatives pose major risks.
- Opt for the F1 Score when both precision and recall are equally important.
Knowing these metrics is essential for picking the right evaluation framework in machine learning.
Explore More
- YOLOv8-Seg Deployment using TensorRT and ONNX
- Data Annotation with Segment Anything Model (SAM)
- Unitlab AI: Data Collection and Annotation for LLMs and Generative AI
References
- Contributing Writer (Jun 27, 2024). What is F1 Score? A Computer Vision Guide. Roboflow Blog: Source
- Harikrishnan N B (Dec 10, 2019). Confusion Matrix, Accuracy, Precision, Recall, F1 Score. Medium: Source

![Guide to Object Detection with a Python Demo [2026]](/content/images/size/w360/2026/01/Object-Detection.png)